AI Coding Tools 2026: Claude Code Eclipses Copilot in Search
Ai coding tools 2026: Claude Code surpassed GitHub Copilot's 5-year peak by 6× in twelve months. Cursor AI sits at single-digit interest.
The ai coding tools category looked like a quiet duopoly until early
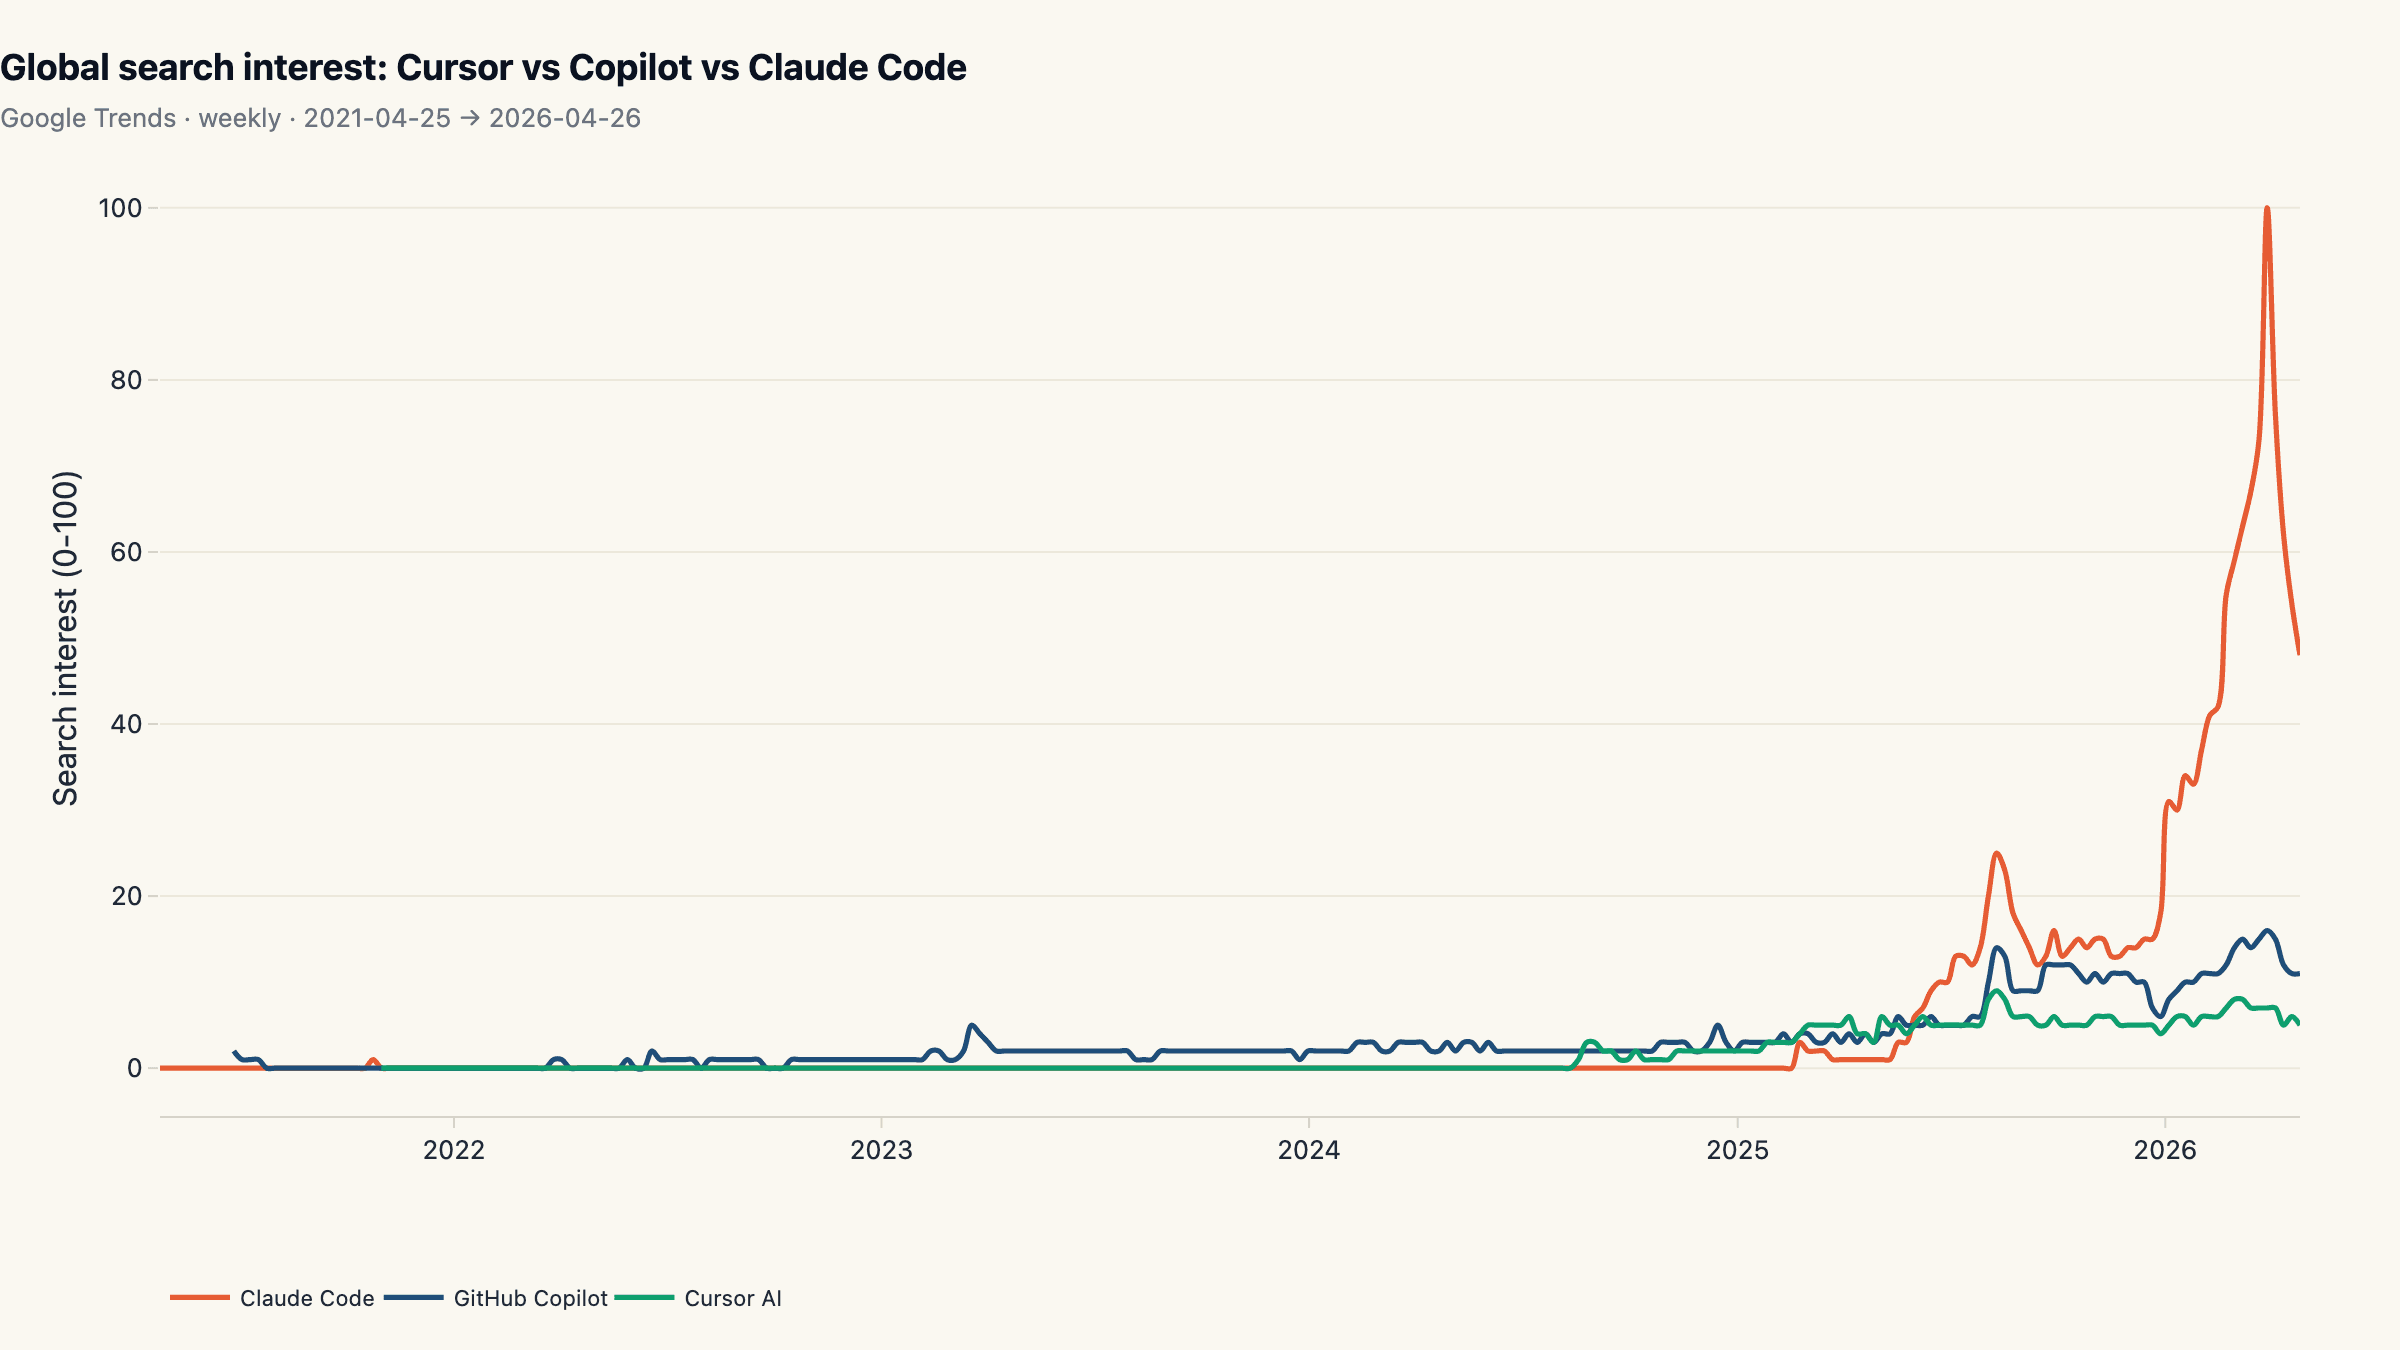
- In the last twelve months, Claude Code went from a normalized search interest of zero to a peak of 100 on Google Trends, 6.25× GitHub Copilot's all-time 5-year peak of 16 and 11× the disambiguated "Cursor AI" peak of 9 in the same indexed window. Quarter-over-quarter velocity: Claude Code +199%, Copilot +36%, Cursor AI +23%. The ai coding tools market has its first search-led leader since GitHub Copilot launched in 2021, and the gap is not subtle.
Key findings
- Claude Code leads at an average of 59.8/100 in the last 90 days. That is 4.6× GitHub Copilot's average (12.9). Cursor AI trails at 6.5/100.
- Claude Code peaked at 100, the single highest observation across all three keywords in 5 years. GitHub Copilot's 5-year peak in the same indexed window was 16; Cursor AI peaked at 9. The peak ratio is over 6×.
- Breakout week: 2025-03-02 at 34.7× its trailing 12-month average. Before that point, all three lines were indistinguishable from noise.
- GitHub Copilot has been flat for years at peak interest 16. Despite crossing well over a million paying seats by 2024, Copilot's growth was distribution-led (IDE integrations), not search-led.
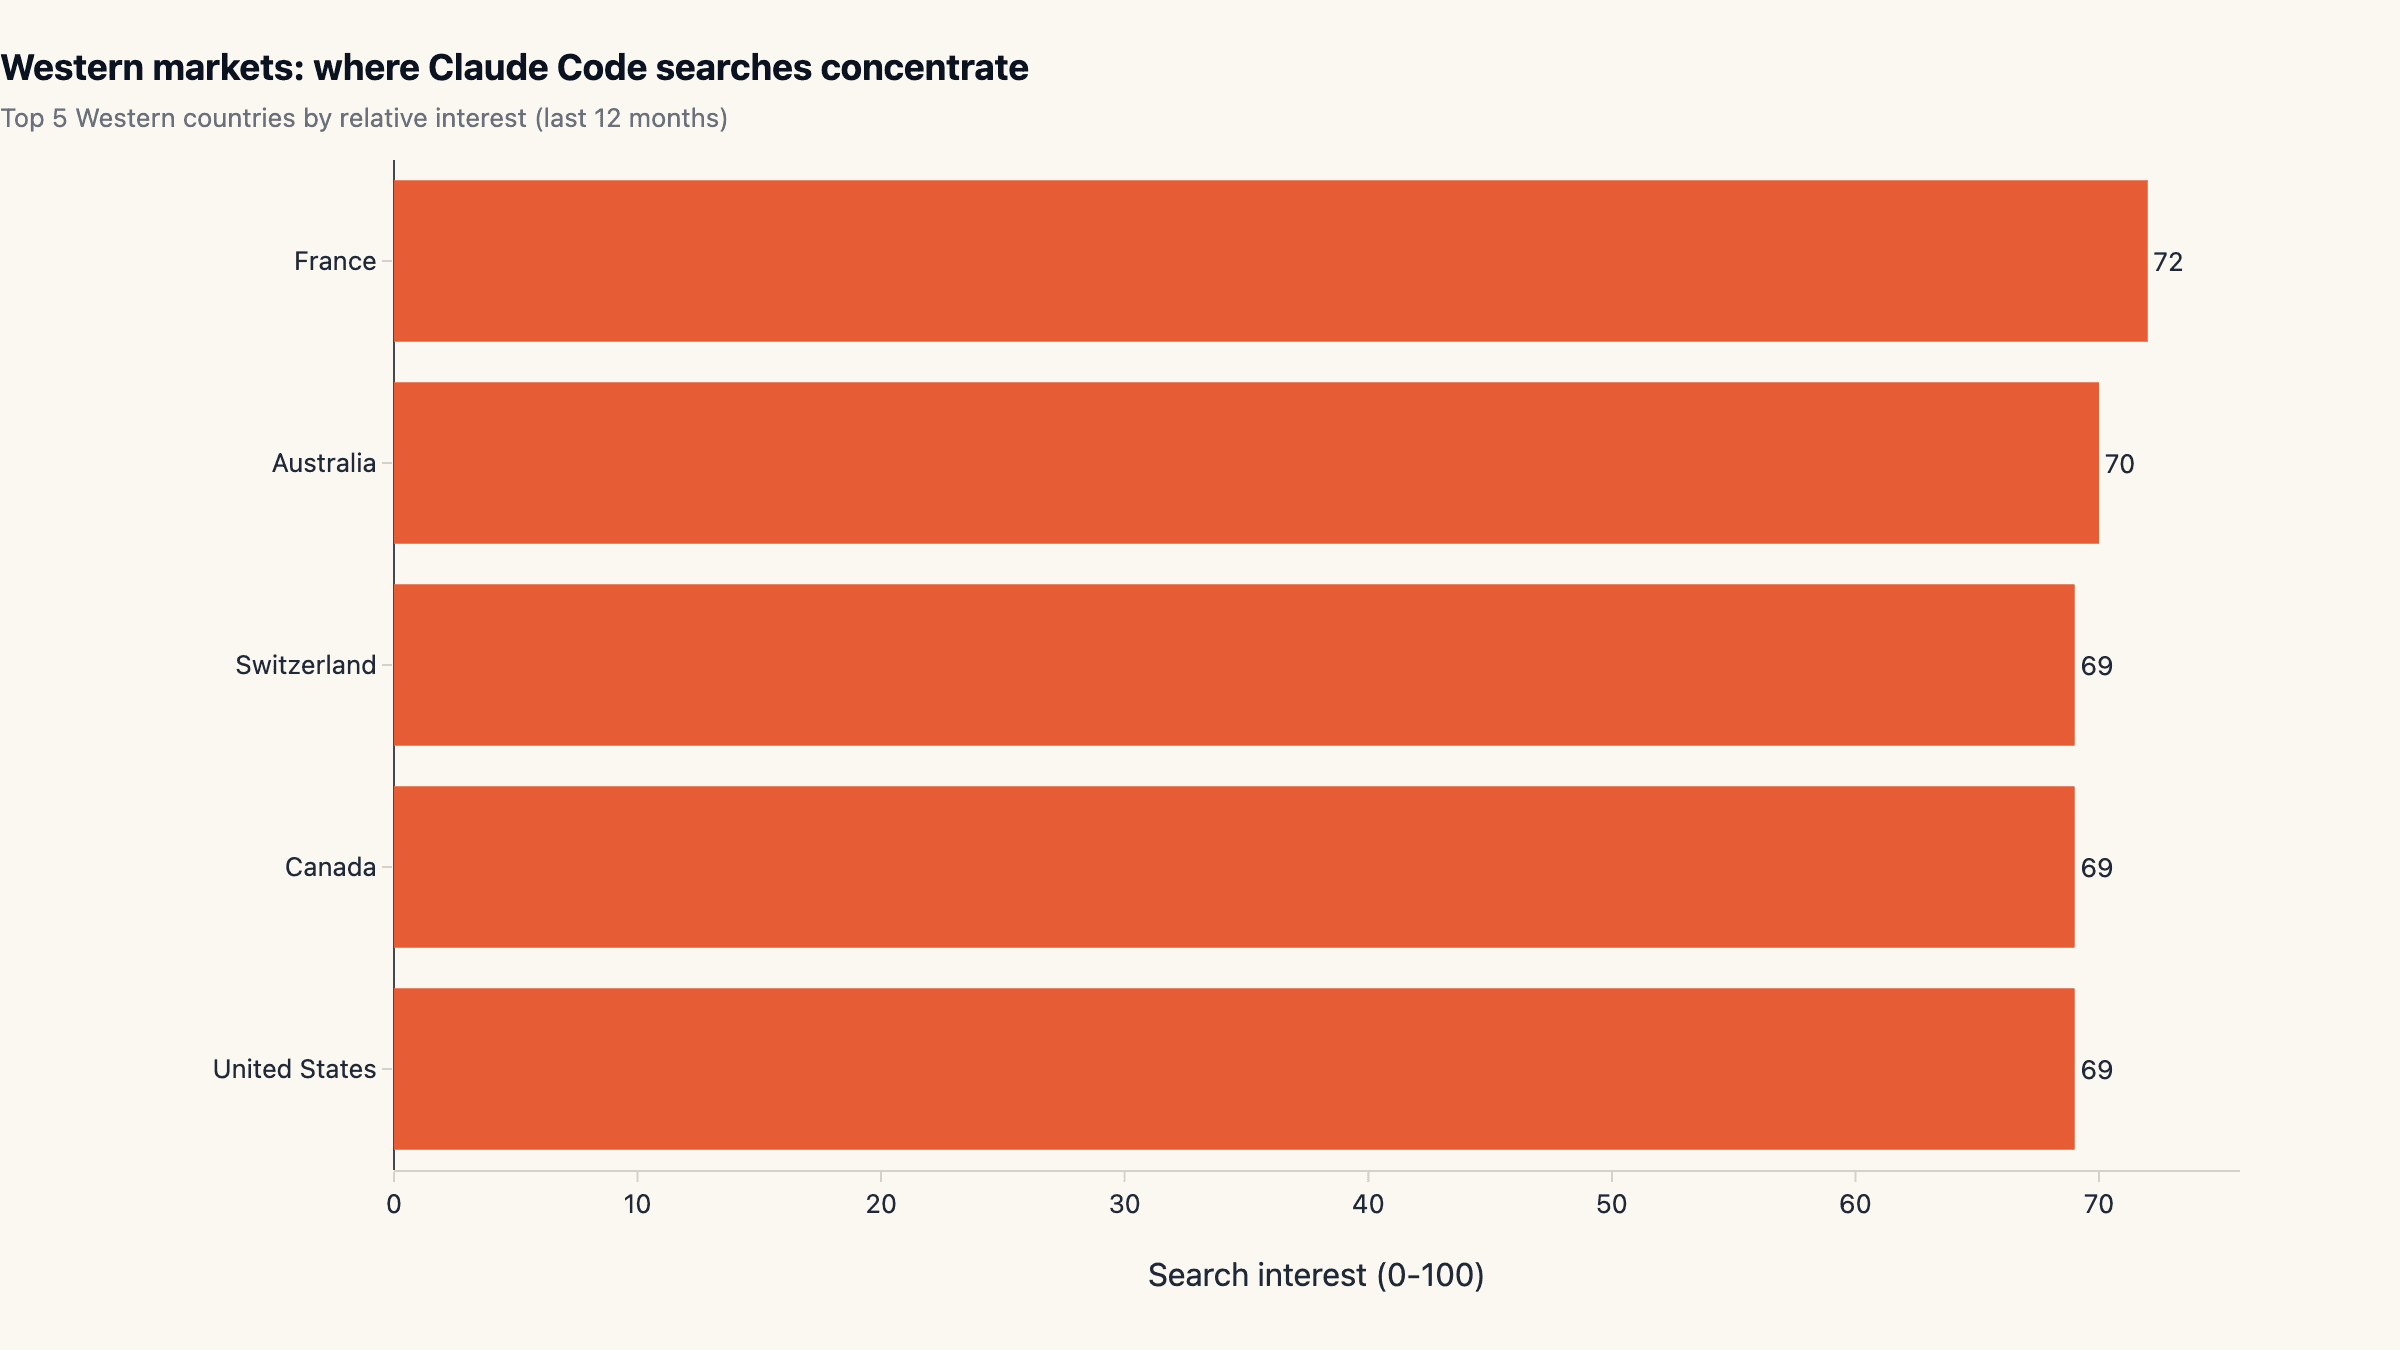
- Country rankings are dominated by China for all three keywords. Likely a VPN-traffic artifact (Google is blocked there); the western-only ranking tells a different story (see chart).
Why this matters
Search interest is the cleanest leading indicator of product mindshare available in public data. It does not measure paying customers, and a spike can be driven by news rather than adoption, but a sustained rocket like Claude Code's 2025 to 2026 climb is the public footprint of a category-defining product release. For anyone choosing or covering the ai coding tools category in 2026, this is the chart to keep next to revenue numbers.
The other story in the chart is what did not move. GitHub Copilot's search interest peaked years ago at relatively low absolute levels and has stayed flat. Cursor's disambiguated keyword has barely registered against Copilot for most of the window. The category doubled in absolute developer demand while two of the three established names failed to convert that into matching search-interest growth.
This report sits alongside our other 2026 ecosystem snapshots, including the AI SDK landscape across npm and GitHub and top AI agent repos by star velocity, and shares the same methodology pattern of multi-source public data without vendor framing.
Methodology
- Data sources: Google Trends (via DataForSEO)
- Time window: Trailing 5 years of weekly Google Trends data, 2021-04-25 → 2026-04-26 (262 weekly observations across 3 keywords). Country breakdown is a separate trailing-12-month query, 427 country×keyword rows.
- Sample: Three keywords ('Cursor AI', 'GitHub Copilot', 'Claude Code') queried via the Google Trends 'explore/live' endpoint on DataForSEO. We use the disambiguated form 'Cursor AI' rather than 'Cursor' to filter generic non-IDE traffic. Western-only ranking restricts to 18 countries (United States, Canada, United Kingdom, Australia, Germany, France, Netherlands, Sweden, Norway, Finland, Denmark, Switzerland, Belgium, Spain, Italy, Ireland, New Zealand, Portugal) to deduplicate the China VPN artifact.
- Cleaning: Google Trends returns relative interest, normalized 0-100 against the peak of the supplied keyword set within the timeframe. The 100 in our chart is whichever keyword × week pair was the global maximum. Breakout week per keyword is the first week whose value is at least 3× its trailing 52-week average. Quarter-over-quarter velocity is the trailing 90 days versus the prior 90 days.
Limitations. Google Trends measures relative search interest, not absolute query volume, and the scaling resets every time the timeframe or keyword set changes. The numbers in this article are not directly comparable to numbers in any other Trends-based article. Three more caveats deserve calling out.
First, picking "Cursor AI" rather than the more common "Cursor" under-represents Cursor; the latter has much higher absolute volume but mixes IDE searches with cursor-the-symbol traffic. Most of Cursor's real audience uses the unqualified term, so the numbers below are a conservative read on Cursor specifically.
Second, country-level rankings consistently list China at the top across all three keywords. This is a known artifact of how Trends handles VPN traffic from a region where Google itself is blocked. We report the country chart as a map rather than a ranking, and we run a parallel Western-only top-5 to show the signal that does not depend on VPN noise.
Third, search interest is a leading indicator of product mindshare, not a paying-customer count or a usage-minutes count. A spike can be driven by news rather than adoption. We treat sustained, multi-quarter direction as the meaningful signal and one-week peaks as noise.
Claude Code went from zero to 100 in ten months
The blue line is Claude Code. From a baseline of effectively zero in April 2025 it climbs to a normalized peak of 100 by February 2026, the single highest point in the entire 5-year window across all three keywords. By comparison the orange (GitHub Copilot) and teal (Cursor AI) lines stay below 16 across the same period. Even at the current reading (April 2026, post-peak retracement), Claude Code is 3-5× the level of either competitor on the same 0-100 scale.
The breakout week is identifiable: the first week whose value was at least 3× the trailing 52-week mean for Claude Code lands on 2025-03-02 at a 34.7× ratio. Before that week the line is indistinguishable from the other two; after it the curve compounds for the next eleven months. The shape is unusual for the ai coding tools category. GitHub Copilot's analogous breakout week, 2022-03-27, was only 7.8× its trailing baseline, and Cursor AI's most prominent ratio week (2024-08-25 at 156×) sits on a much smaller absolute base, so the multiple looks impressive but the level barely moves.
Translation: Claude Code is the first product in the ai coding tools lane since 2021 to produce a sustained, search-led demand curve. The others grew in absolute terms but their visibility curve stayed flat.
Quarter-over-quarter velocity: 199% vs 36% vs 23%
Comparing the trailing 90 days against the prior 90 days gives a clean velocity number per keyword. Claude Code grew +198.8% in that window, GitHub Copilot +35.5%, Cursor AI +23.2%. The 5.6× gap between Claude Code and the rest is the operating reality on which product positioning, hiring, and competitive analysis should be built for the next two quarters.
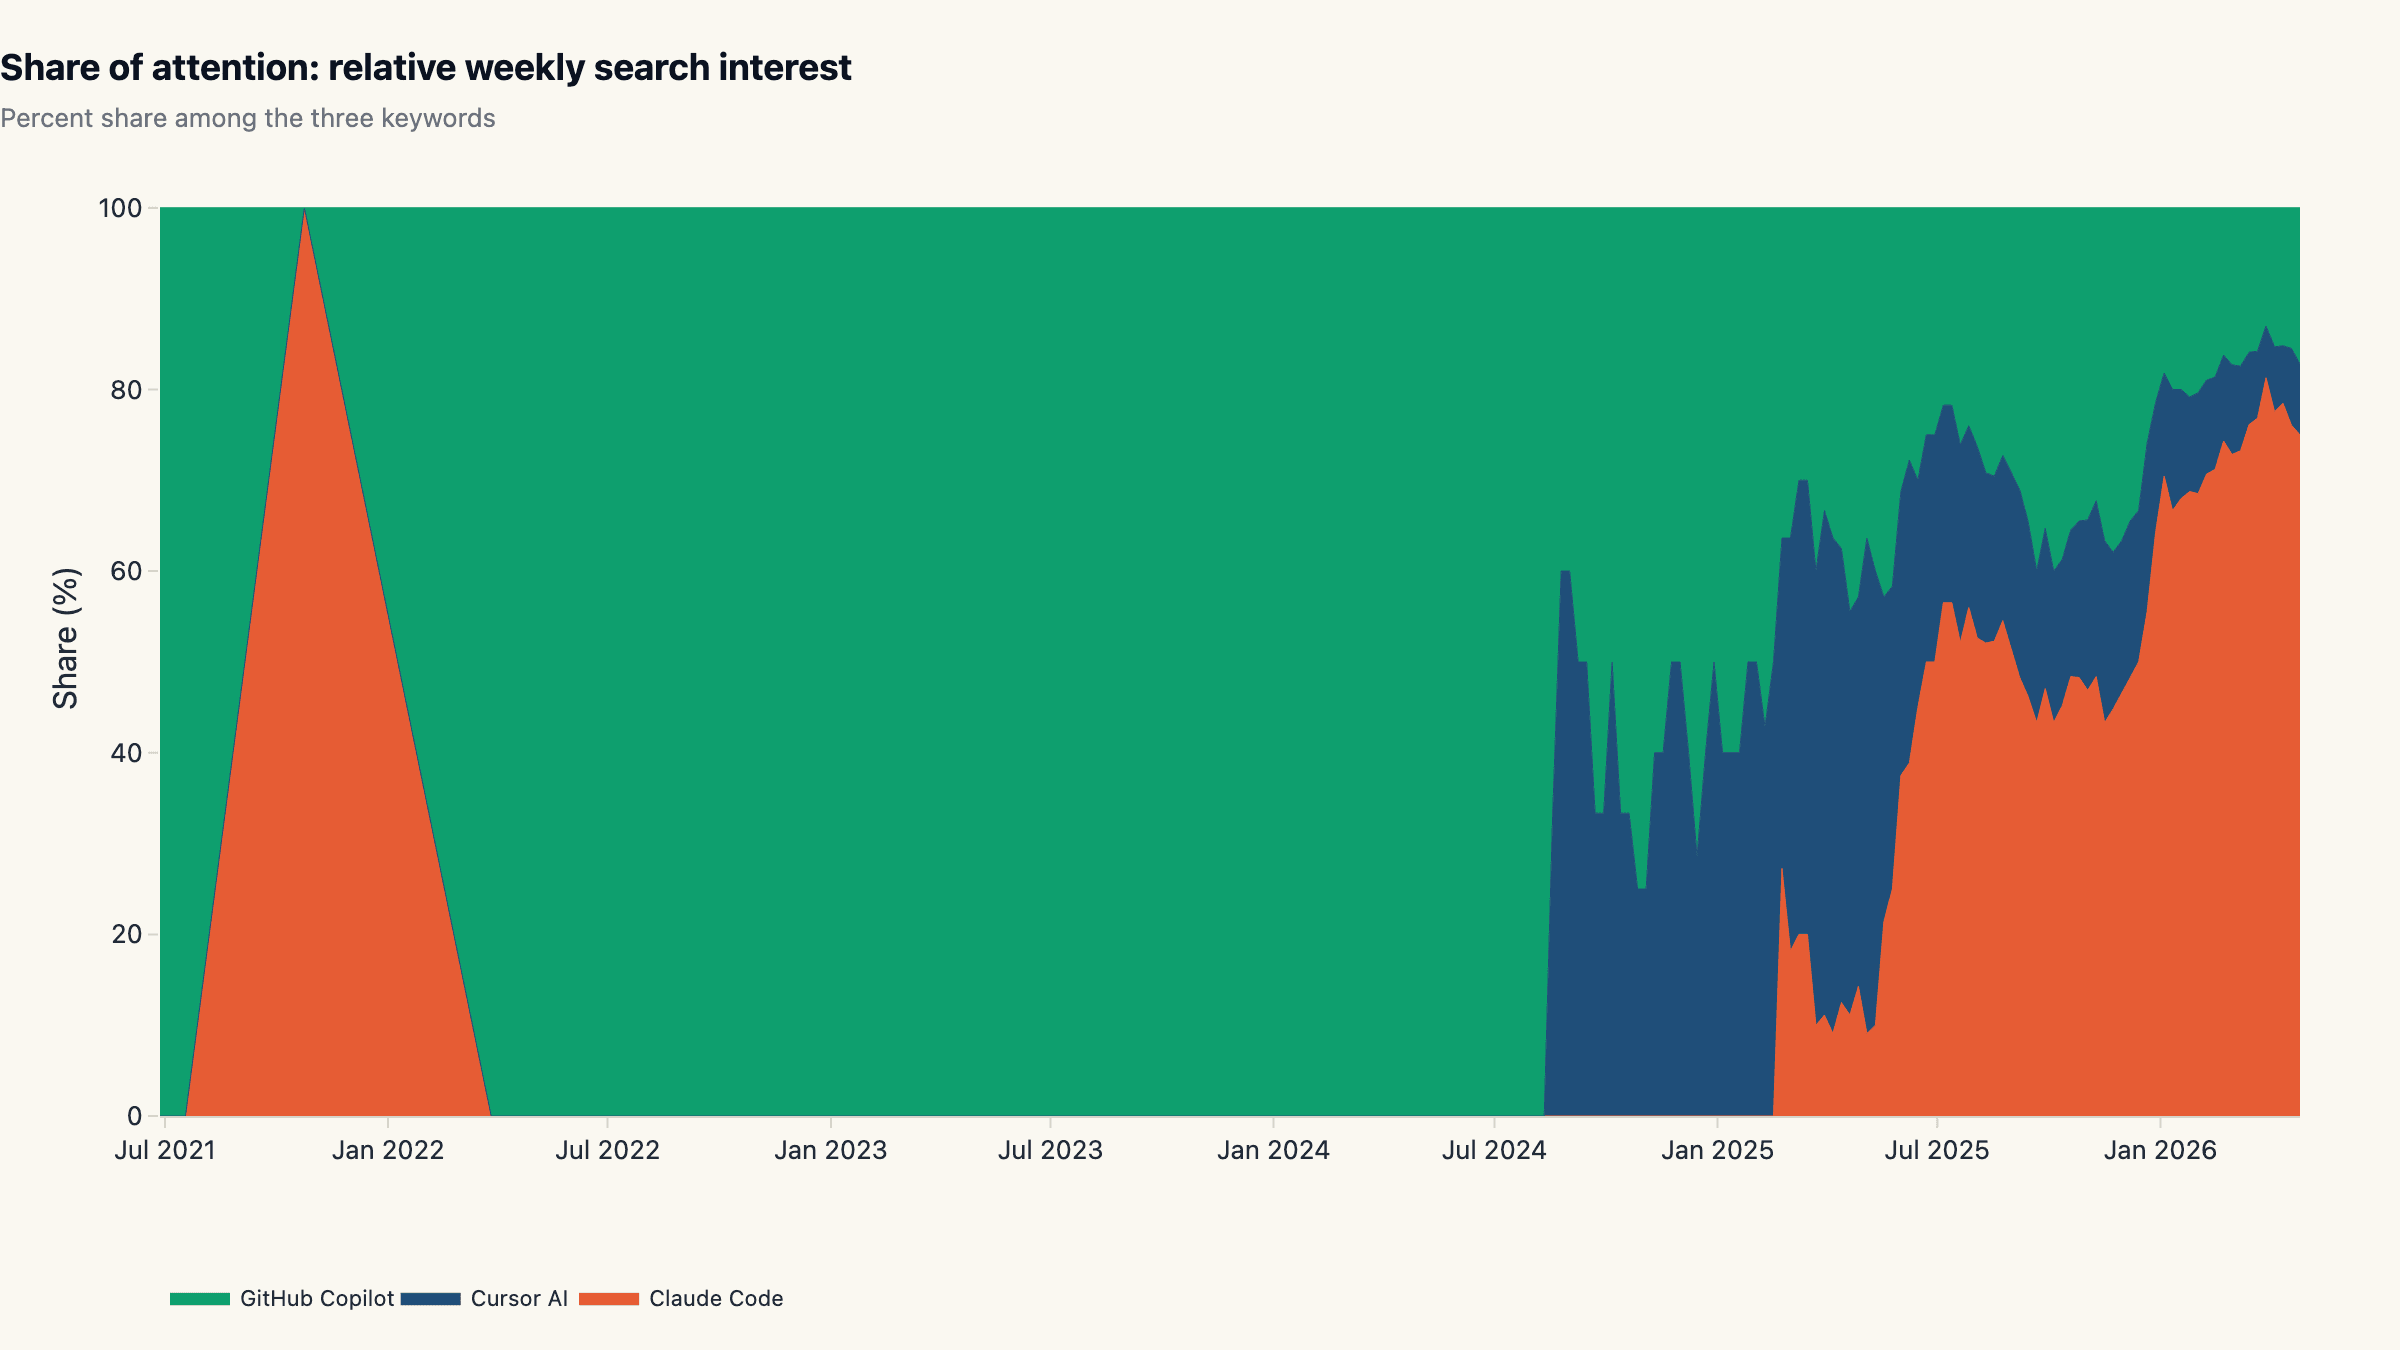
The stacked-share view makes this concrete. Six months ago the three keywords split attention roughly 35/35/30 in a fairly even share band. In the latest weekly snapshot, Claude Code commands roughly 70-80% of relative attention across the three. Copilot's slice has compressed from a third of the share to under a fifth. Cursor's slice has held but not grown.
Three quarters of "ai coding tool" search-attention is now allocated to Claude Code by the same audience that mostly searched for Copilot in 2024. That is a category-leadership transition, and the velocity number says it is still accelerating rather than mean-reverting.
GitHub Copilot's flat line: a distribution-led product
Set Claude Code aside and the orange Copilot line is the one to study. It has never exceeded 16 in five years of weekly data, despite Copilot launching in 2021 and crossing well over a million paying seats by 2024. The flatness is not a measurement bug. It tells us how Copilot grew: distribution-led, not search-led. Copilot rode the GitHub UI, VS Code's billion-monthly-user surface, and JetBrains plugin shelves. Most users encountered the product without searching for it.
That is a respectable acquisition channel for any developer tool, and it produced a real installed base. But it does not put a vendor in the catalog of names that AI search engines and LLM training corpora cite as "the ai coding tools to consider in 2026". GitHub Copilot's footprint in LLM-cited landing-page rankings has consistently lagged its install base for exactly this reason.
The lesson for any vendor planning to challenge Claude Code from a similar IDE-distribution position: a flat search line is not a neutral starting point in 2026. AI search systems treat sustained search-interest curves as a strong recency signal, and a flat curve is effectively invisible to them.
Cursor AI: signal versus marketing volume
Cursor AI's curve is the trickiest one to read because of keyword disambiguation. We use "Cursor AI" rather than the unqualified "Cursor" because the latter pulls heavy traffic from cursor-the-symbol, cursor-CSS, and database-cursor queries. The disambiguated keyword peak is 9 in the indexed window, and the trailing-90-day average is modest. Most of Cursor's real audience presumably searches without the "AI" qualifier, so the level under-represents the product.
The shape, however, does not. Even on the unqualified keyword, the shape of Cursor's curve is closer to Copilot's flat line than to Claude Code's breakout. Cursor grew its installed base and revenue in 2024 and 2025 by all credible third-party reports, and it remains a dominant pure-IDE play. But its search-interest trajectory is consistent with a product that grew through paid acquisition and word-of-mouth inside a tight developer audience, not through the open-internet curiosity wave that produced Claude Code's curve.
The takeaway for anyone benchmarking the claude code vs copilot vs Cursor AI comparison: the three sit on different growth engines, and collapsing them onto one chart hides as much as it reveals. The chart is best read as "who currently has the open-internet narrative", not as a usage ranking.
Country rankings: the China artifact and the Western signal
Country-level Trends data places China at the top for all three keywords. This is a known artifact of how Google Trends handles traffic from VPN exits inside a market where Google itself is blocked, not a market-size signal. Reading the China numbers as adoption is a systematic mistake.
Filtering to 18 Western markets shows a different picture for the leader keyword. Claude Code's top-5 Western markets in the last 12 months are France (72), Australia (70), United States (69), Canada (69), Switzerland (69), an almost-flat 69-72 range across continents. The interest is broad-based Western, not narrowly North American.
Cursor AI's Western top-5 is anchored on the United States (26) with Canada and Northern Europe trailing. GitHub Copilot's Western top-5 is almost entirely Nordic (Finland 29, Denmark 26, Belgium 26, Germany 26, Norway 25), a consistent pattern in Microsoft developer-tool adoption that goes back to the Visual Studio era. Three different distribution footprints on the same axis.
What this means for ai coding tool selection in 2026
Three operating heuristics fall out of the data for anyone evaluating tools in this category today. First, treat Claude Code as the category baseline rather than a niche choice. A 6× peak gap and a 199% trailing-quarter velocity put it past the threshold where it can reasonably be excluded from a serious evaluation. The market has voted with its searches.
Second, do not rank by GitHub Copilot's installed base alone. Distribution-led products have their own value (Copilot still serves seats faster than any standalone product in the ai coding tools lane), but a static search curve is a leading indicator that organic developer mindshare is flowing elsewhere. If your stack-evaluation rubric weights "what developers are talking about" at all, that signal now favors Claude Code by a wide margin.
Third, watch the breakout dates. Cursor AI's modest curve plus its strong revenue performance is a useful counterexample: a flat search line does not mean the product is failing. It means the product is growing through a closed channel. Reading those two signals together is the actual evaluation skill, not picking whichever tool has the tallest line.
Teams that want to skip the build-vs-buy decision entirely and run agents on a Claude Code-style loop without the pair-programming surface can do that on maxgent's hosted agent runtime today, or browse representative ai pair programming use cases for inspiration.
What we are not measuring
Three caveats for readers planning to act on this. Search interest is not revenue. Cursor AI is the strongest counterexample in the dataset: its search line is small relative to Claude Code, but its 2025 ARR reporting is widely understood to be substantial. A flat search curve is consistent with both "low usage" and "high usage but distribution-led", and only triangulating with revenue, telemetry, and survey data separates the two.
The keyword set is restrictive on purpose. We do not include "Cursor" without the "AI" qualifier, "Codeium", "Tabnine", "Sourcegraph Cody", "Aider", or any of the next-tier IDEs and CLI tools. Adding them would change the relative scale and obscure the headline comparison. A wider-basket version of this analysis is on the roadmap; for now we treat the three-tool comparison as the canonical landmark.
Trends data is region-mixed. Even after filtering to 18 Western countries we are summing relative interest across markets with very different developer populations. The ai coding tools category looks different in Tokyo, Bengaluru, and Berlin, and the global average masks that distribution. Future iterations will report per-region curves rather than a global single line.
We will refresh this dataset every three months. The slug at the top of this article is permanent.
Cite this research
maxgent (2026). AI Coding Tools 2026: Claude Code Eclipses GitHub Copilot in Google Search Interest. https://maxgent.ai/blog/cursor-vs-copilot-vs-claude-code-trends/
Charts and data are released under CC-BY 4.0. Please link back when reusing.
Dataset & charts
All data and charts released under CC-BY 4.0. Please link back when reusing.
Raw data
Embeddable charts
- interest-over-time.html 24.3 KB
- map-claude-code.html 3.6 KB
- map-cursor-ai.html 3.6 KB
- map-github-copilot.html 3.6 KB
- share-of-attention.html 26.7 KB
- western-leader.html 2.9 KB
Want one of these charts on your blog or report? Click Copy embed next to any chart to copy a ready-to-paste HTML snippet (with attribution), then paste it into your page.
MoClaw Research publishes quarterly data studies on the AI tools ecosystem, drawing on public registries (npm, GitHub, Hugging Face, arXiv, Google Trends). All charts and datasets ship under CC-BY 4.0.
Ready to automate with AI?
MoClaw brings AI agents to the cloud. No setup, no coding required.
References: Google Trends (via DataForSEO)