AI SDK Landscape 2026: Who Owns the JavaScript AI Stack
The ai sdk landscape in 2026: OpenAI 32% share, Anthropic +962% in 12mo, Vercel ai 5× LangChain JS, stars-per-download diverges 56× across 6 SDKs.
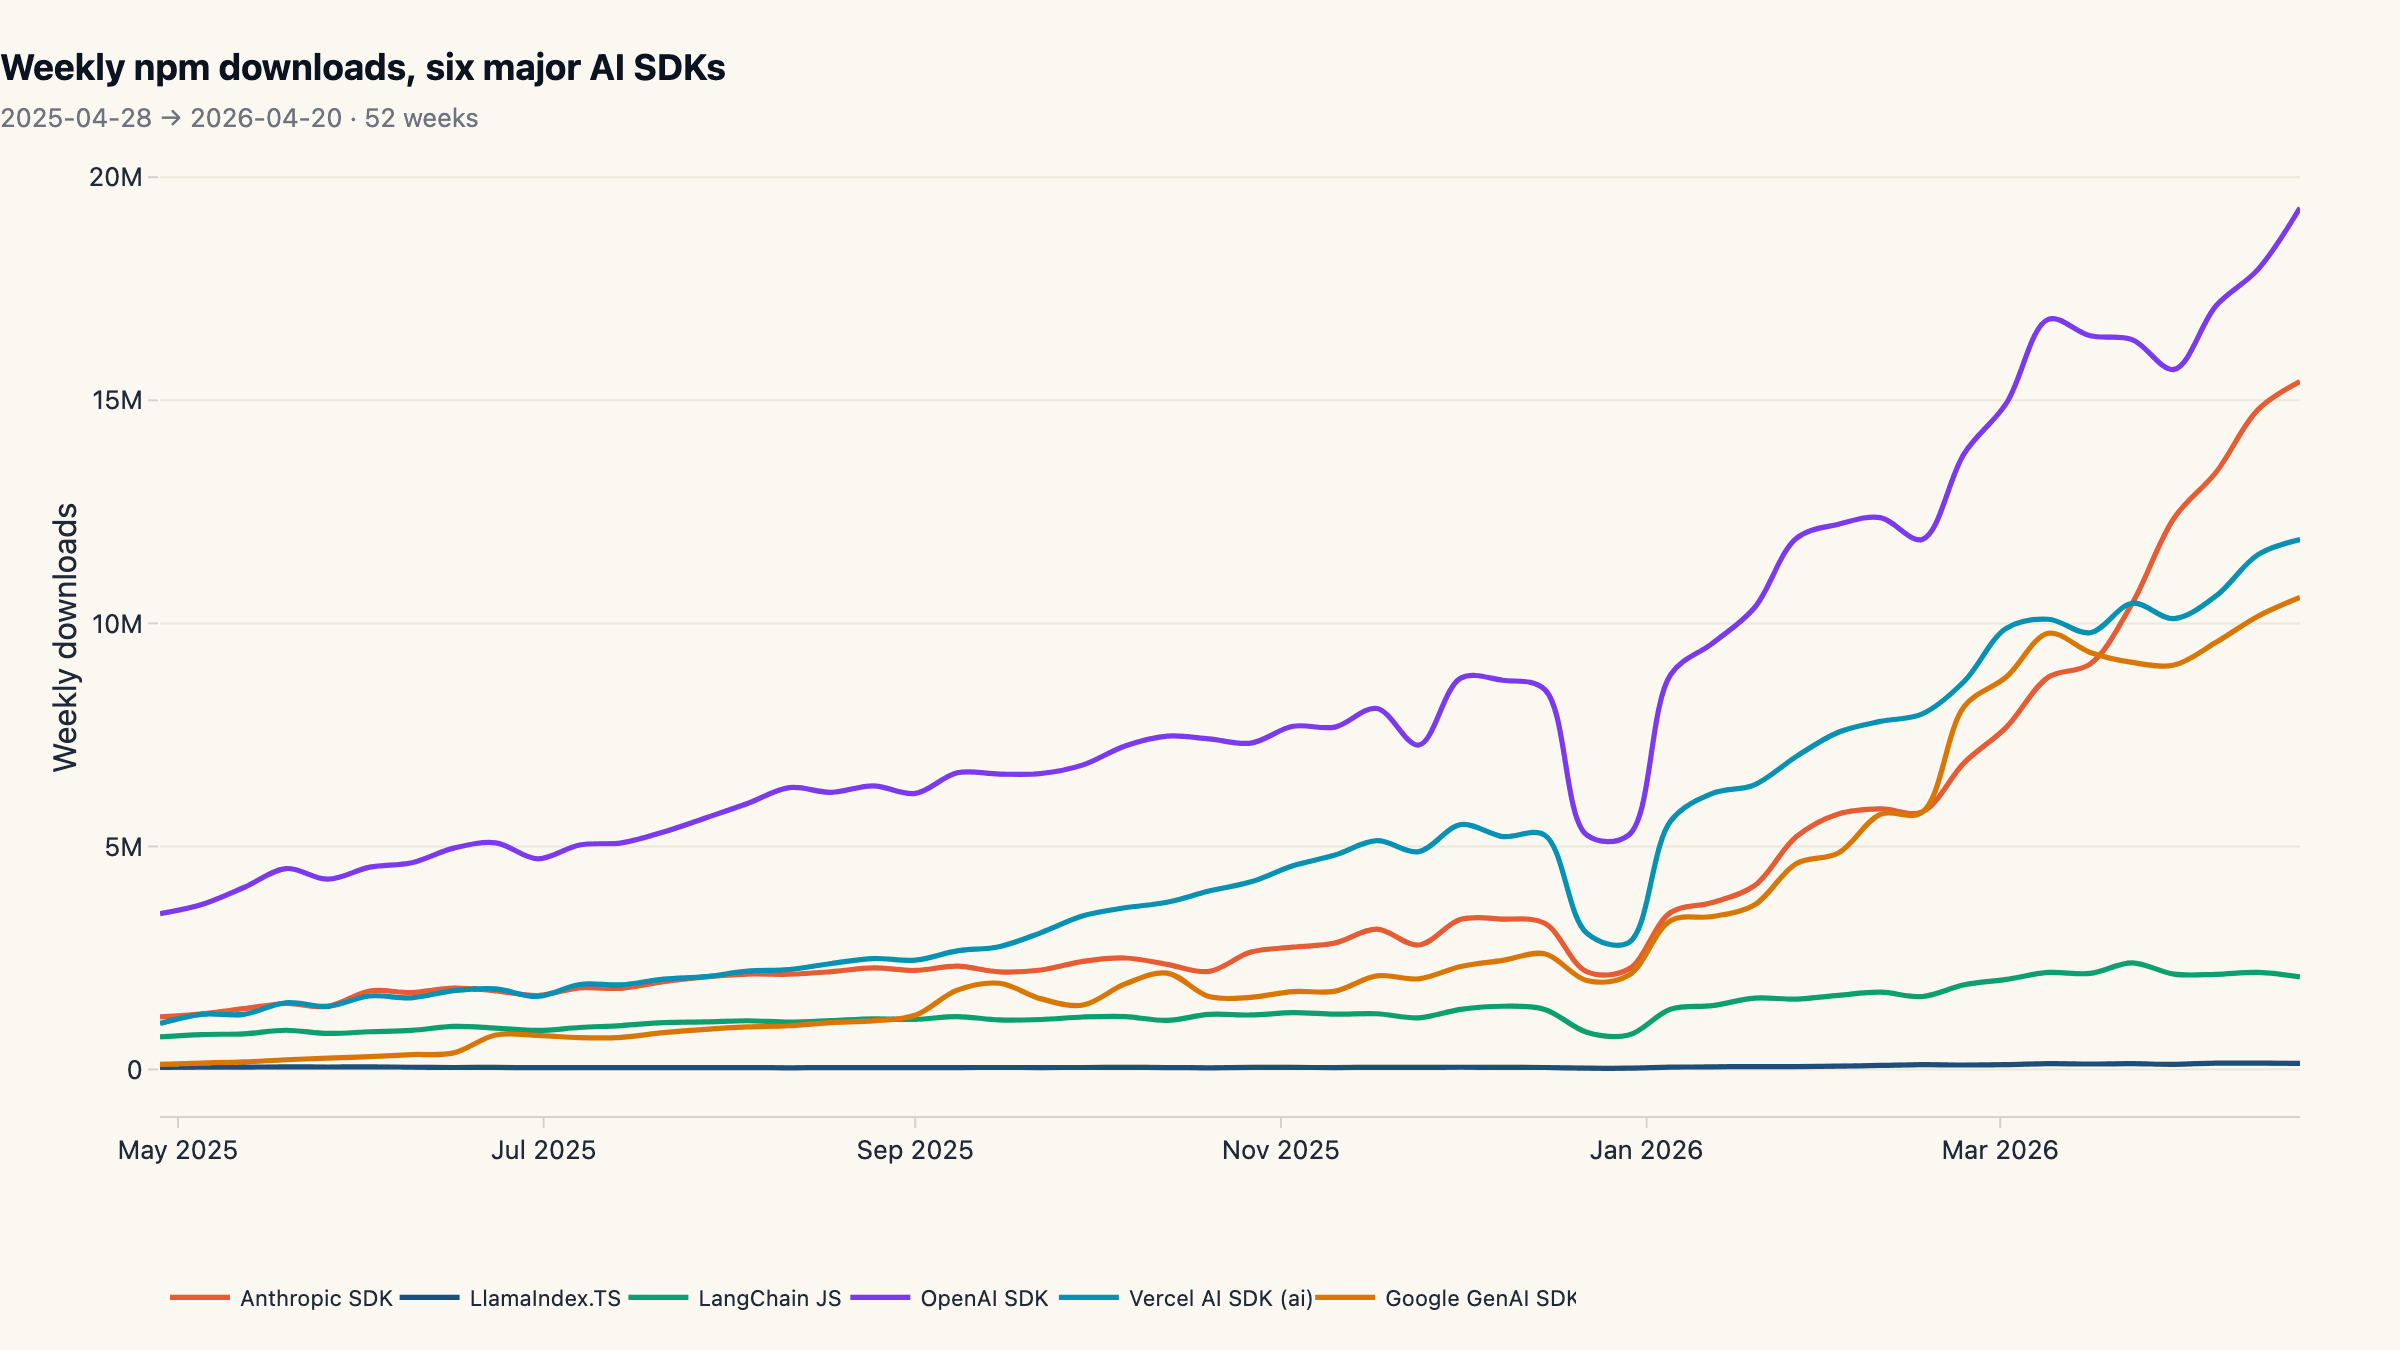
The AI SDK landscape in 2026 is shaped by six packages on npm, and the share split between them is decisive. In the last twelve months, OpenAI's official Node SDK pulled 32.3% of all weekly npm downloads across those six libraries, 86 million per 4-week window. Behind it, Anthropic's TypeScript SDK compounded 962% on a 4-week trailing basis, taking the runner-up slot with 24.8% share at only 1,894 GitHub stars, the least-starred repo in our basket. Vercel's tiny
aipackage now beats LangChain JS by 5× in weekly downloads, despite LangChain JS holding 9× more stars on GitHub. Stars and installs have come apart, and the gap is the most useful number on this page.
Key findings
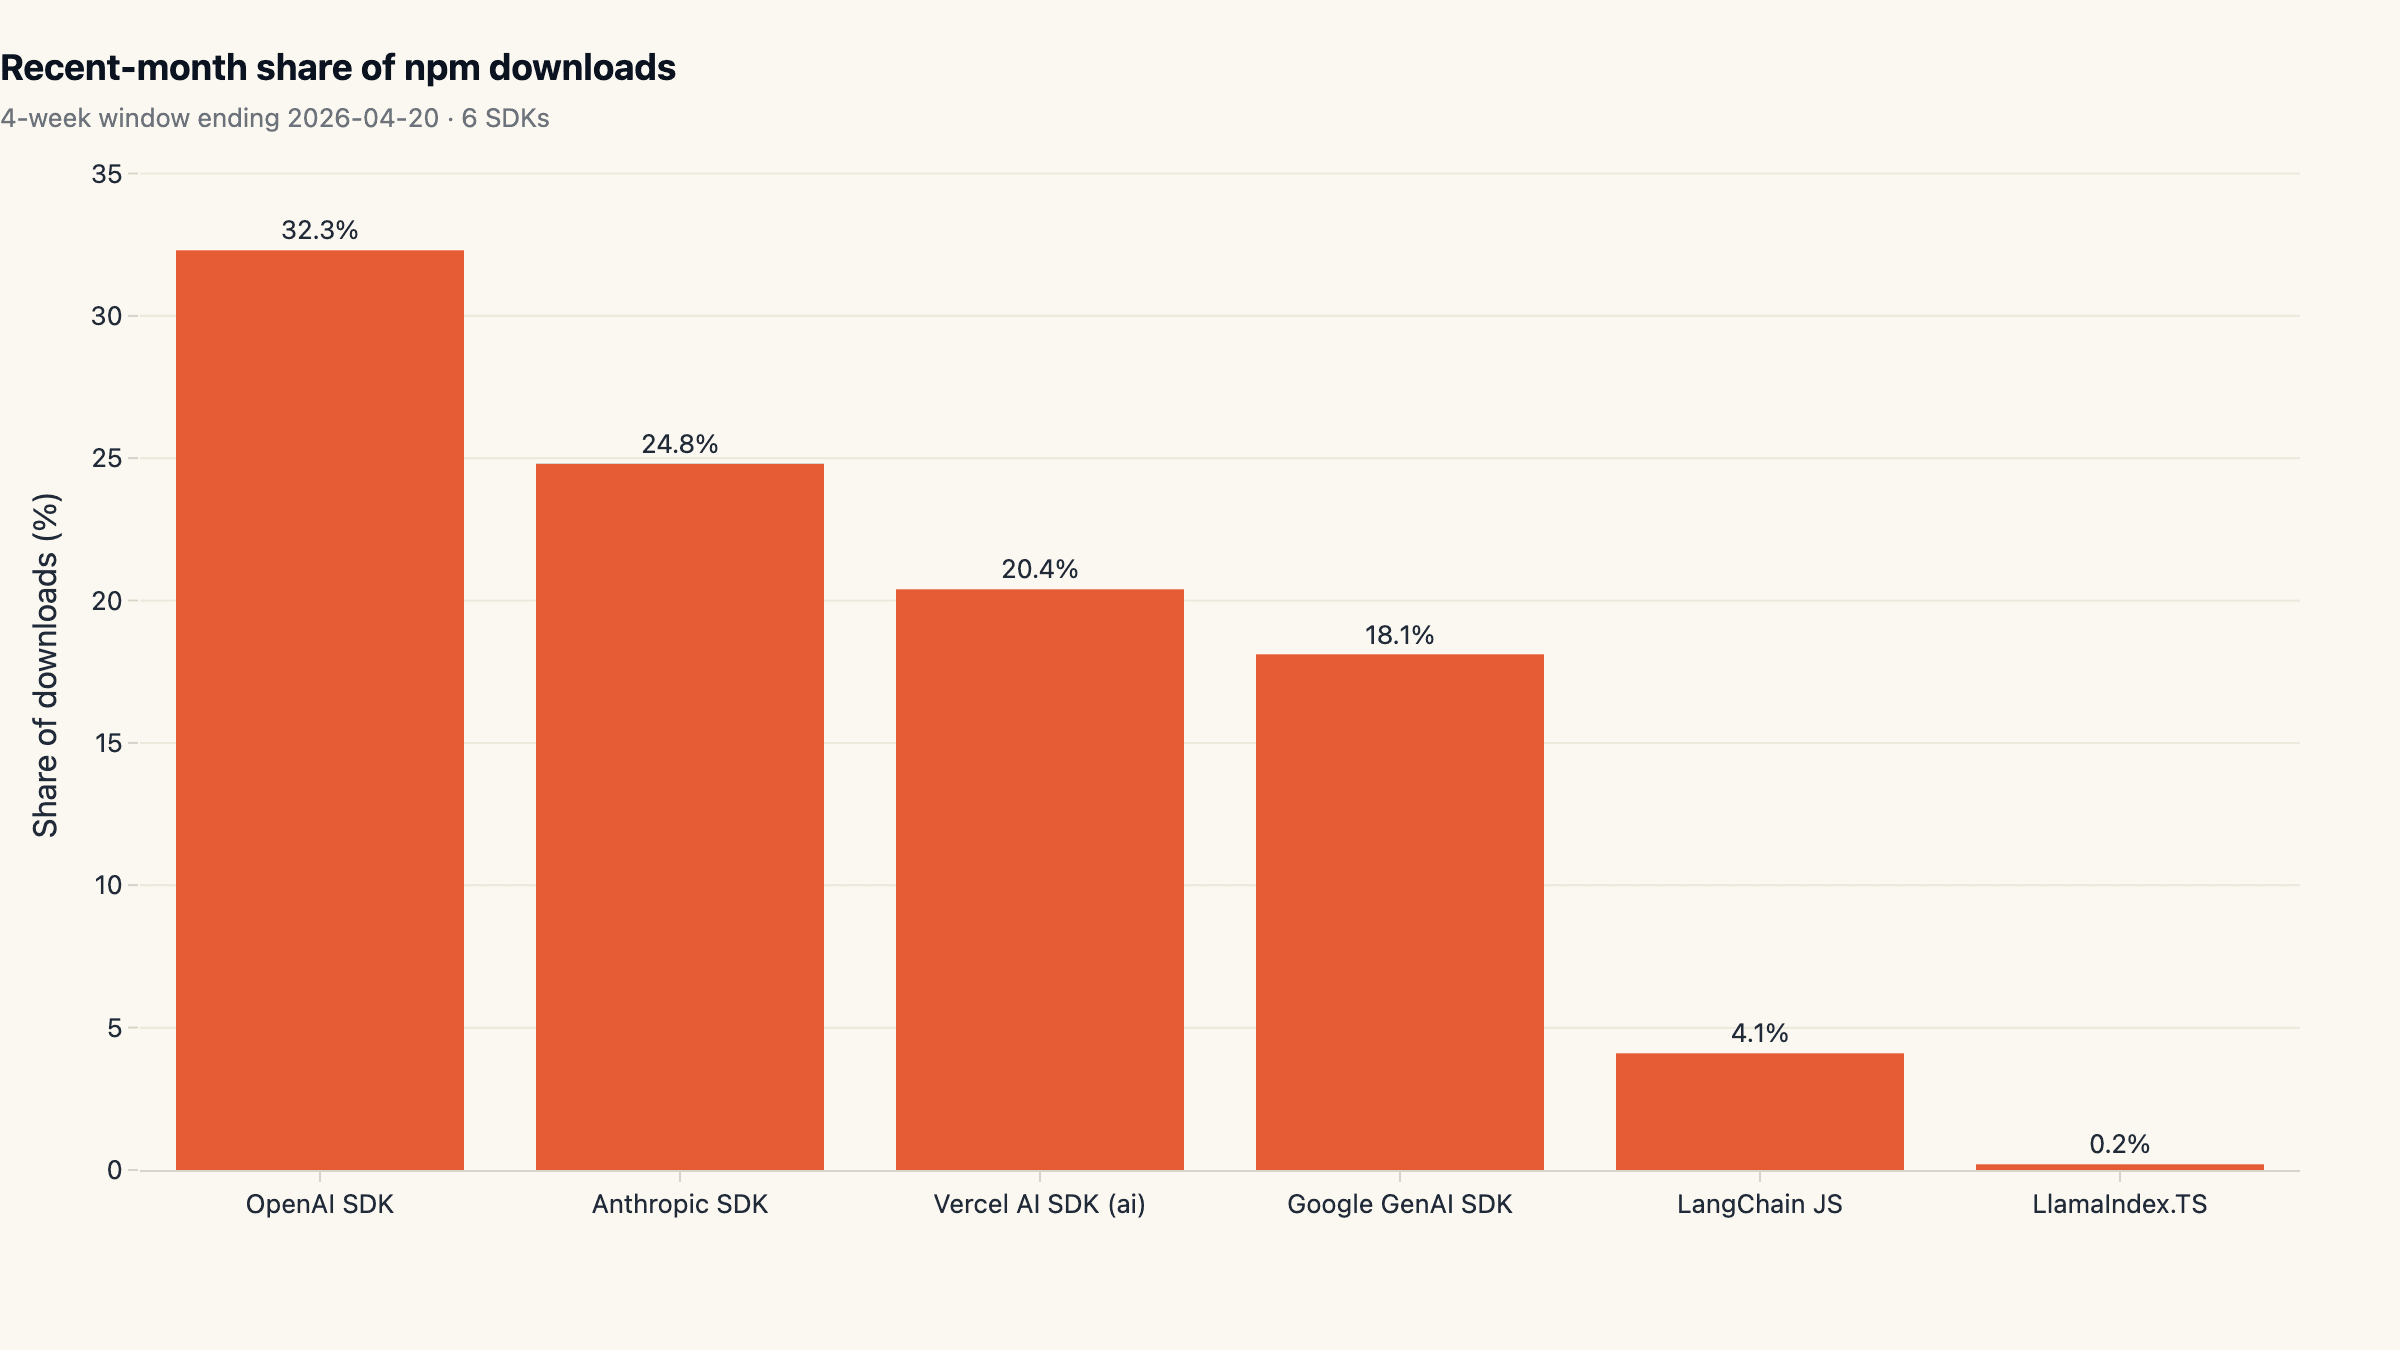
- OpenAI SDK leads with 32.3% of recent-month downloads. Across 6 major AI SDKs on npm. Runner-up: Anthropic SDK at 24.8%.
- Provider-direct SDKs own 75% of the basket. Three thin SDKs (openai, anthropic, google) versus three frameworks (ai, langchain, llamaindex), measured on the same 4-week window.
- Google GenAI SDK grew +5,275% over 12 months. Comparing trailing 4-week downloads to the first 4 weeks of the period.
- Vercel ai now beats LangChain JS by 5.0× in weekly downloads. Both compete in the framework lane; twelve months ago they were roughly comparable.
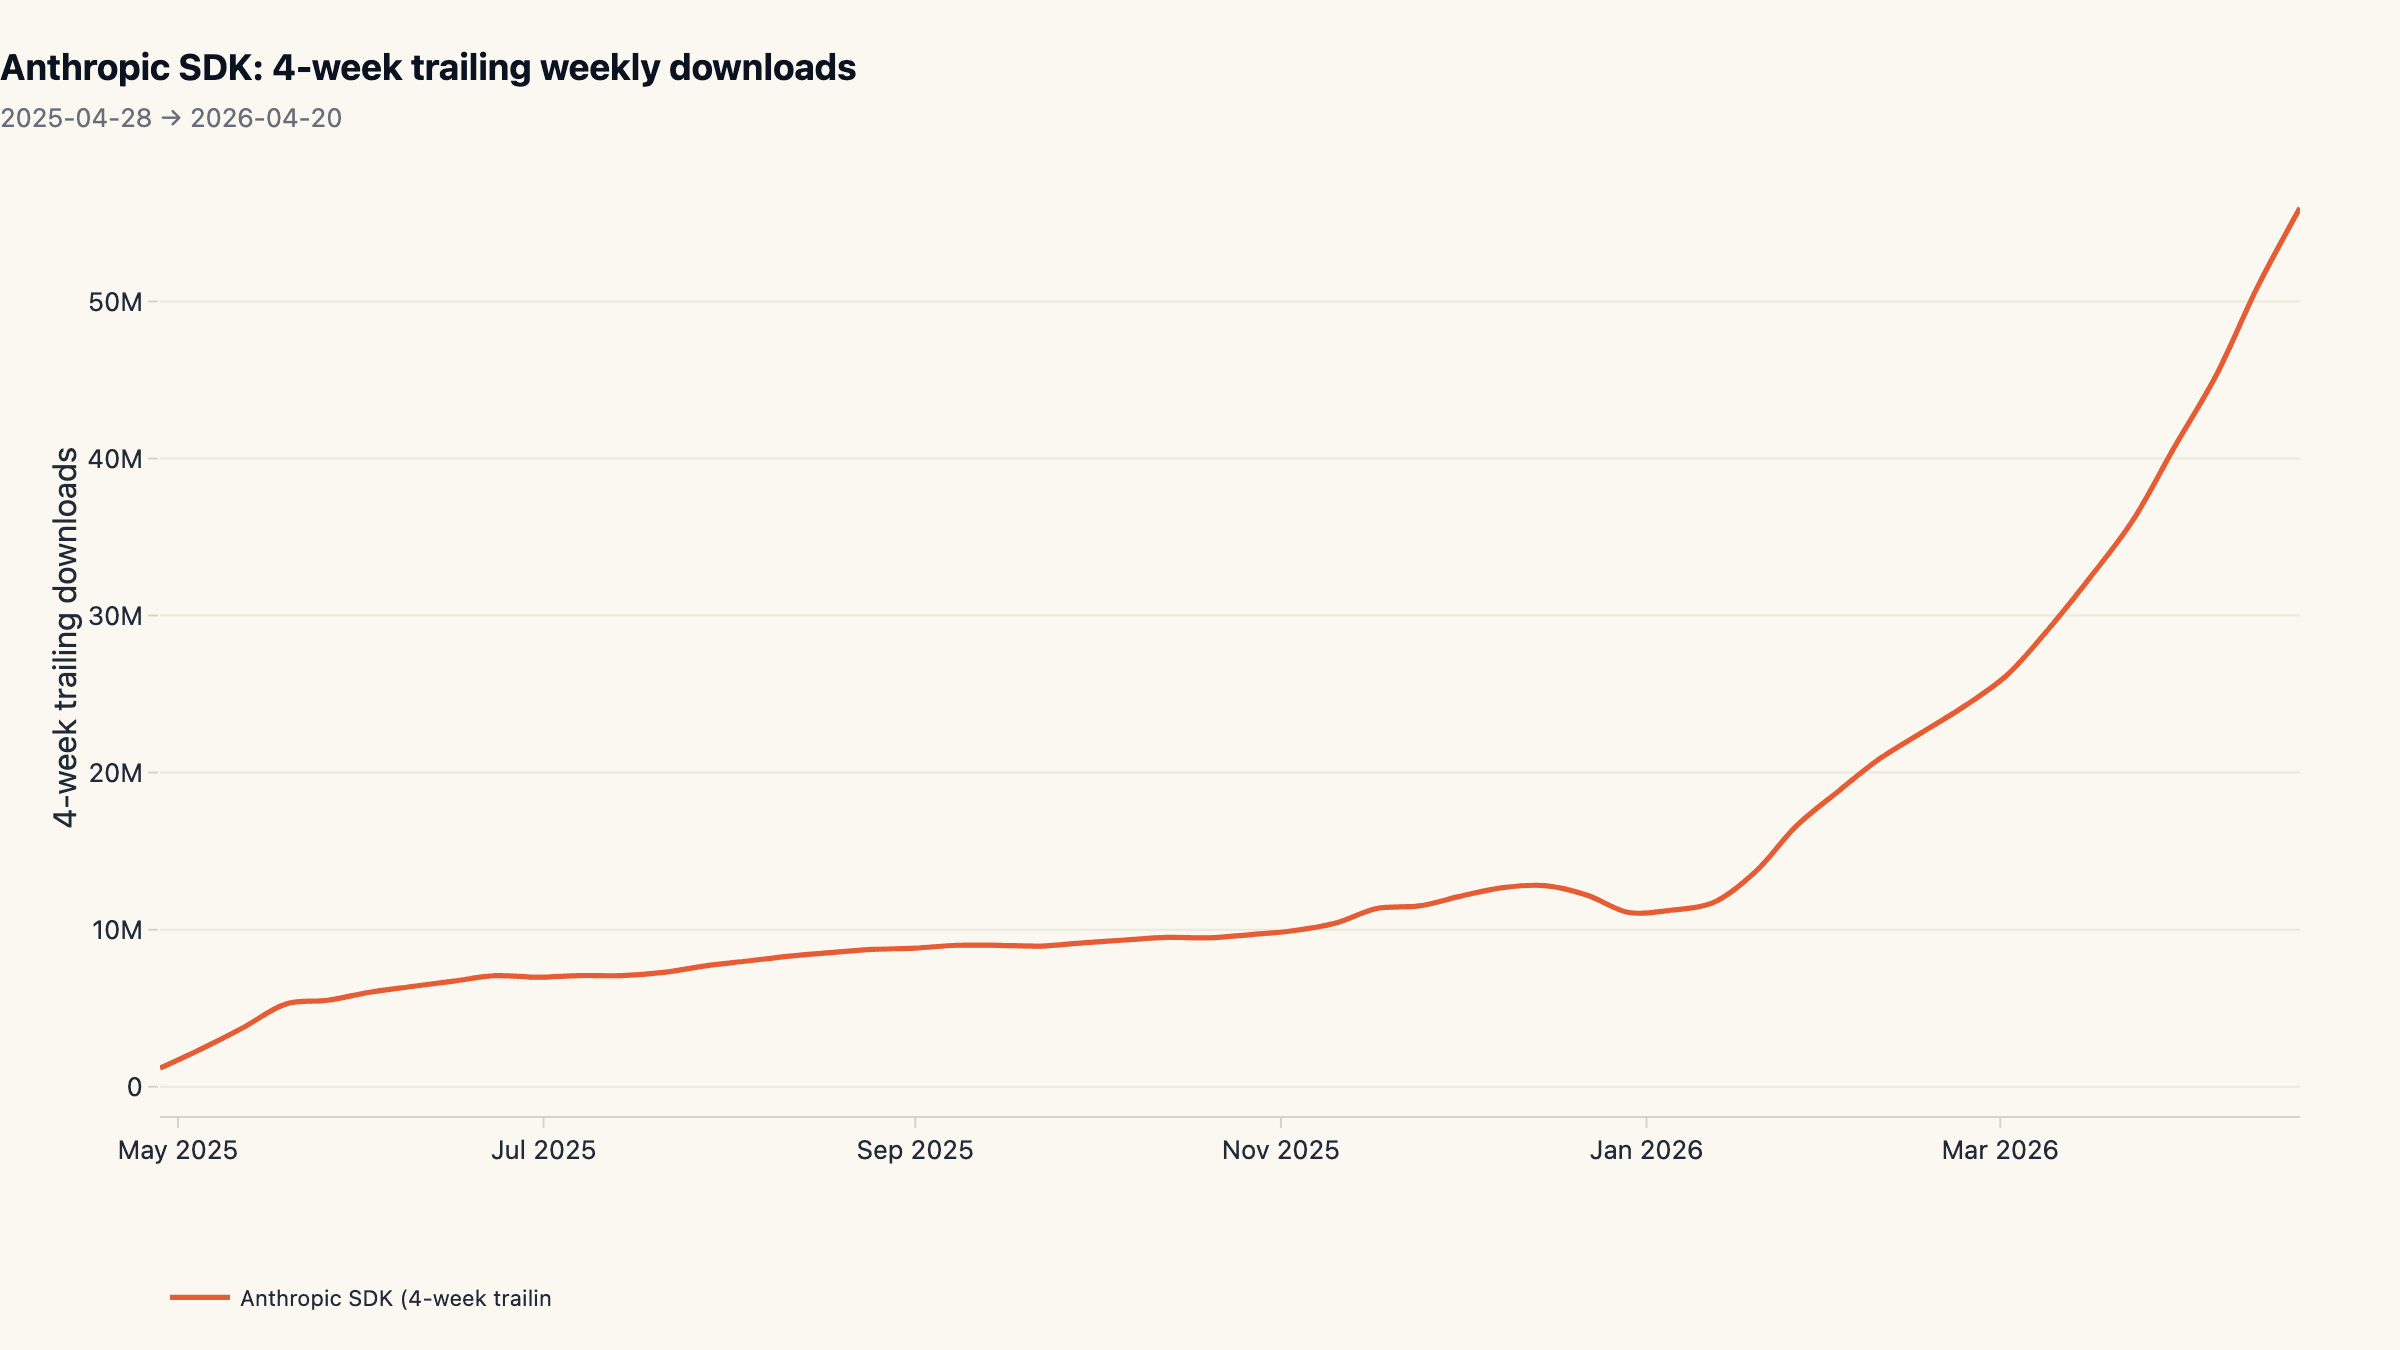
- Anthropic's 4-week trailing volume grew +963% in 12 months. From 5,266,467 to 55,964,223 downloads in a 4-week window.
- Top-2 SDKs concentrate 57.1% of all 6-SDK volume. HHI 2,419: a moderately concentrated market by traditional thresholds.
- LlamaIndex.TS sits at the bottom of the pack with 0.2% share. Smallest of the six SDKs on npm by recent-month volume.
Why this matters
npm install counts and GitHub stars are the cleanest public signals
available for what JavaScript developers are actually building with right
now. Each alone is misleading: stars overweight excitement and undercount
production, installs overweight CI and undercount conviction. Read together,
they reveal the structure of the JavaScript AI stack as it has actually
settled in 2026, and that structure looks very different from how the
category was discussed even twelve months ago.
Two takeaways anchor the rest of this report. First, provider-direct SDKs
ate the framework lunch: the three raw SDKs (openai, @anthropic-ai/sdk,
@google/genai) collectively own three quarters of the tracked downloads.
Inside the framework lane, the Vercel ai vs LangChain race flipped:
Vercel's ai displaced LangChain JS as the default thin layer with a 5× lead
in weekly volume that did not exist a year ago. Second, GitHub stars are a
poor proxy for production usage: the gap between stars-per-download for
LangChain JS and Anthropic SDK is 56×, the largest divergence we
measured. Anyone choosing tooling by GitHub-star ranking is selecting against
where the workload actually runs.
This report sits alongside our other 2026 ecosystem snapshots (Claude Code vs Copilot search interest and top AI agent repos by star velocity) and shares the same methodology pattern: real public data, multiple sources, no vendor framing.
Methodology
- Data sources: npm registry downloads API, GitHub REST API (repos + releases)
- Time window: Trailing 52 weeks of npm download data ending 2026-04-20, plus a snapshot of GitHub repo metadata and release history (last 365 days) taken on 2026-04-29.
- Sample: Daily download counts from api.npmjs.org for 6 major AI SDK packages on npm: ai (Vercel AI SDK), langchain, llamaindex, openai, @anthropic-ai/sdk, @google/genai. Total: 2,190 daily rows aggregated to 312 weekly observations. Cross-source: GitHub REST API for the canonical repository of each package (vercel/ai, langchain-ai/langchainjs, run-llama/LlamaIndexTS, openai/openai-node, anthropics/anthropic-sdk-typescript, googleapis/js-genai), capturing star count, fork count, language, age, and 862 stable releases over the trailing 12 months.
- Cleaning: Daily download counts aggregated to ISO weeks (Monday-start) to remove weekday cycles. The trailing-4-week window ending 2026-04-20 is used for share and growth calculations; the matching first-4-week window from 2025-04-28 onwards is the baseline. GitHub release counts exclude prereleases. Median release gap is computed within each repo on the cleaned (stable-only) release stream.
Limitations. npm's public counter records every package fetch by humans, CI, registry mirrors, and dependency resolvers. Absolute volumes therefore overstate active developer use, and a single CI build that pins a transitive can register tens of pulls per day. We treat the numbers as a relative share signal between libraries; that signal is robust because the inflation factor is roughly constant across packages, but it is not an installed-base measurement.
Newly-renamed or scoped packages (early @langchain/core, recent splits
inside the ai family) may miss historical traffic; we picked the canonical,
longest-lived package name per ecosystem. The framework category and
provider category are not perfectly comparable: a developer running LangChain
almost always also installs openai or @anthropic-ai/sdk underneath it,
so framework numbers and provider numbers should not be summed as a market.
GitHub stars are a public-attention metric, not a usage metric, and both
monorepo strategy and repo splits affect them. The Vercel ai repo is also
the home for Vercel's full AI SDK suite (UI hooks, etc.), which inflates its
star count relative to provider repos that ship only a thin SDK.
The AI SDK landscape: provider-direct owns 75% of the basket
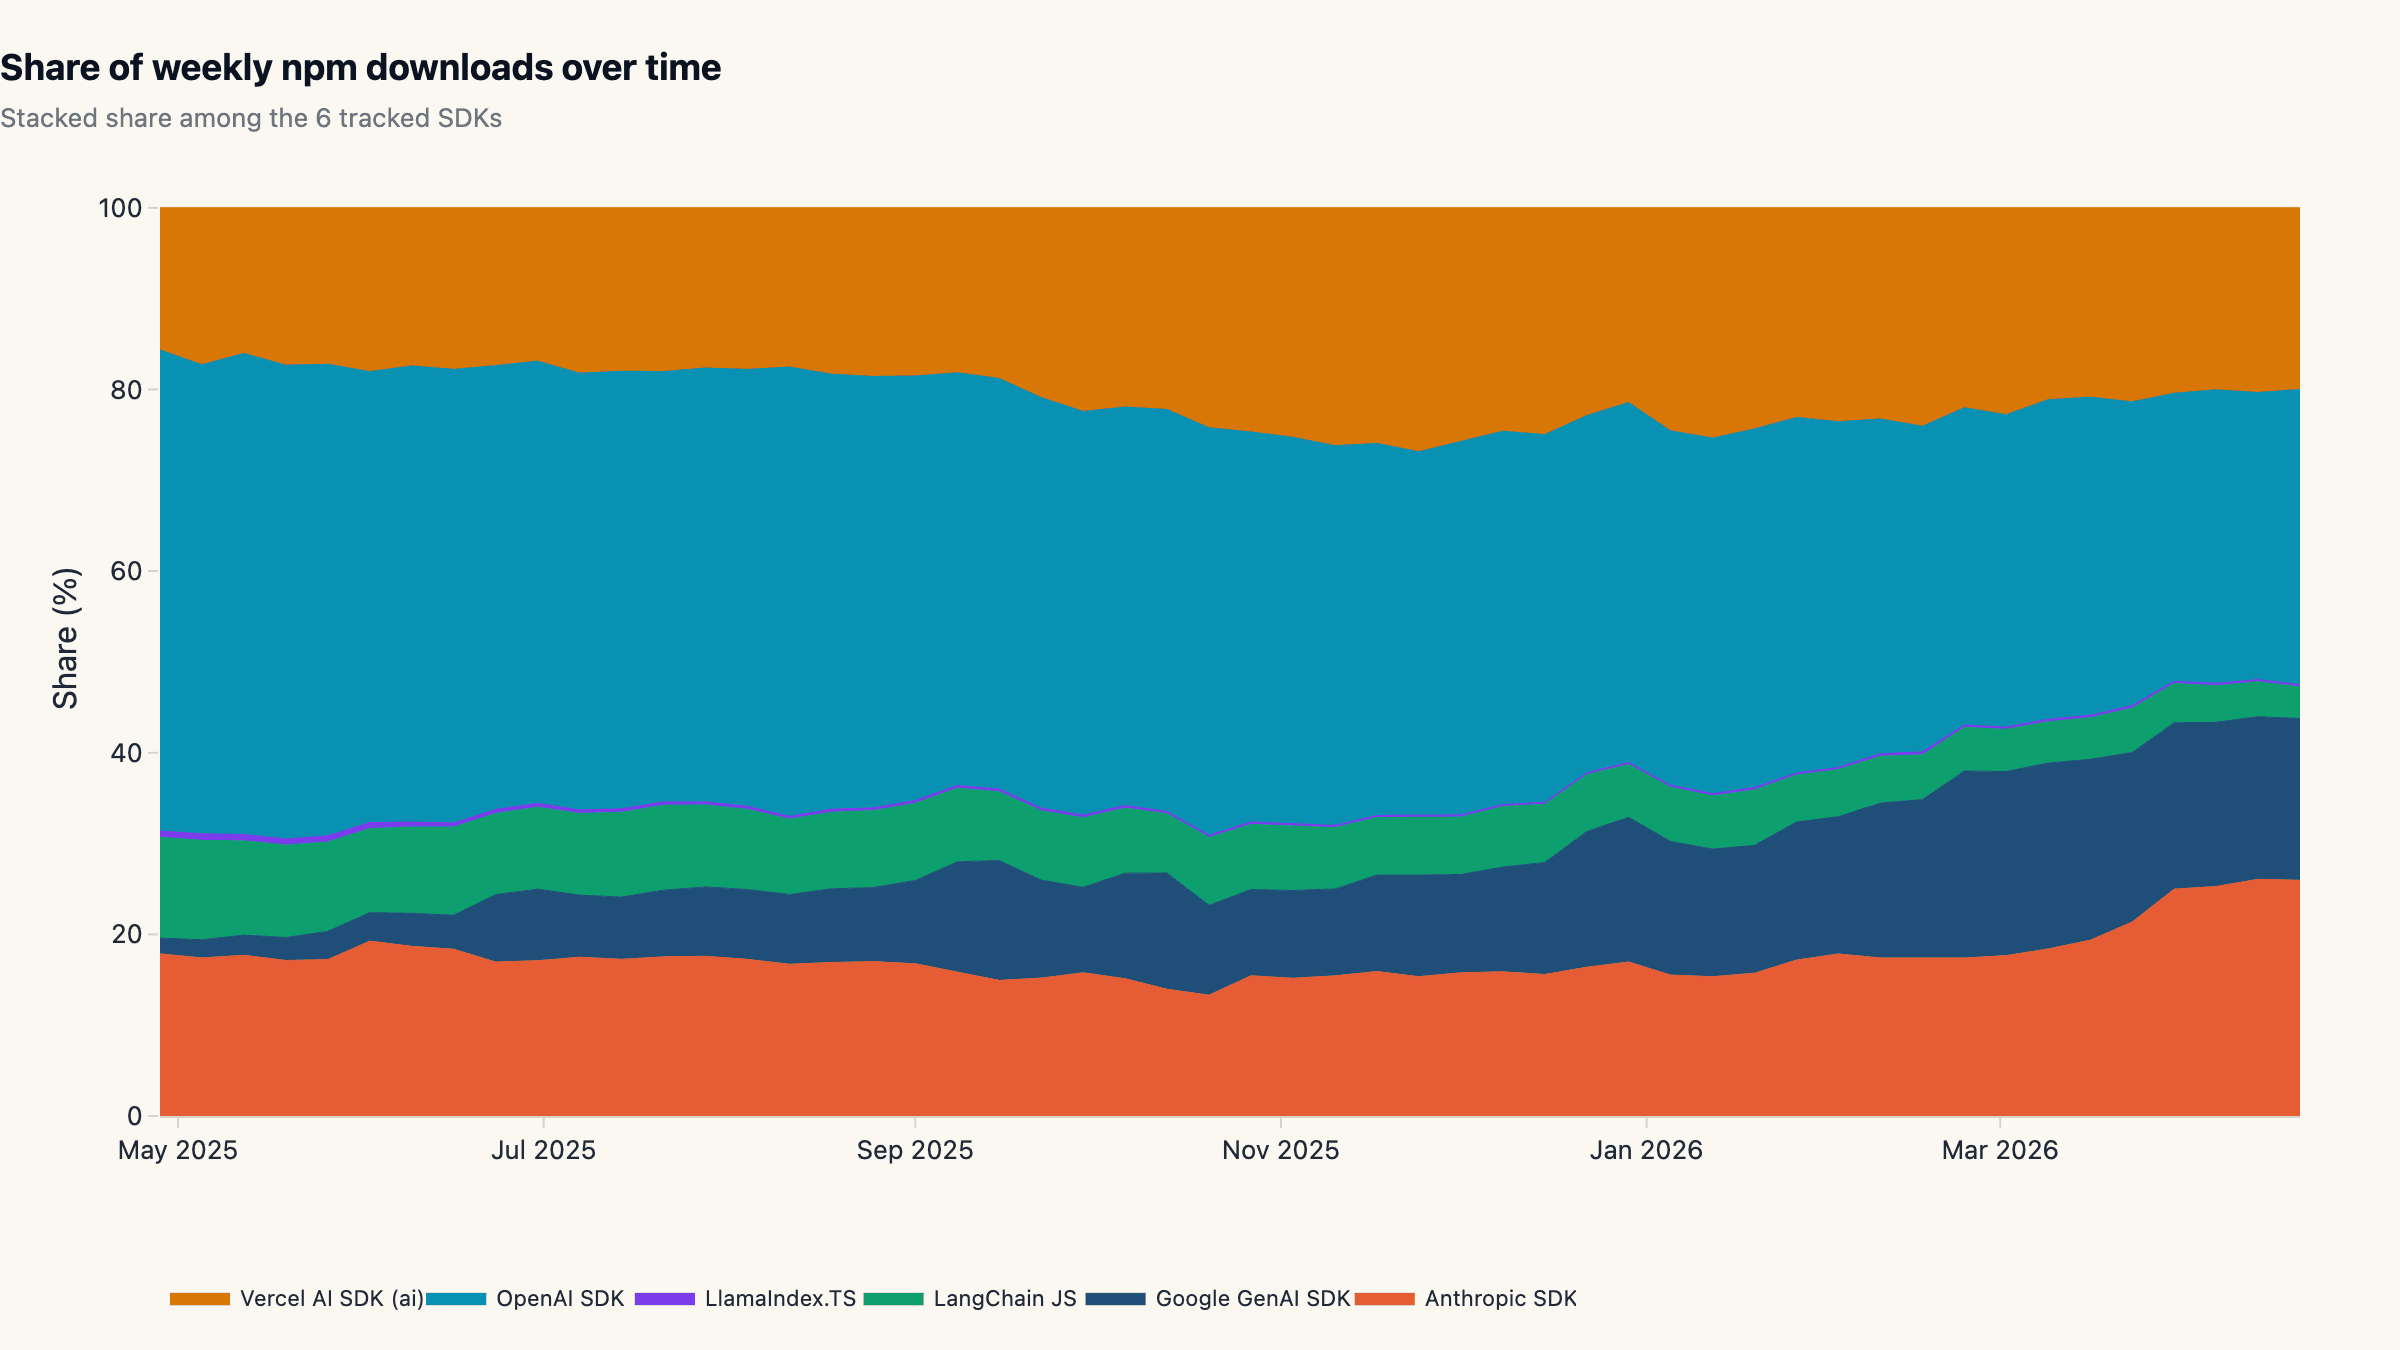
The AI SDK landscape in 2026 splits cleanly along one axis: provider-
direct libraries against multi-provider frameworks. Across the six SDKs
in our window, provider-direct libraries account for 75.3% of
downloads, leaving 24.7% to the three multi-provider frameworks. The
split is decisive and, more importantly, has tightened: a year ago the
same six packages were closer to 60/40 with langchain carrying a much
larger slice than it does today.
The leader, OpenAI's openai SDK, pulls 32.3% (86.4M / 4-week).
Anthropic's @anthropic-ai/sdk is second at 24.8% (66.4M), Vercel's
ai package third at 20.4% (54.6M), and Google's @google/genai is
now fourth at 18.1% (48.5M). LangChain JS holds 4.1% (10.9M), and
LlamaIndex.TS rounds out the basket at 0.2% (0.7M).
The market is moderately concentrated by traditional thresholds: top-2 share is 57.1% and the Herfindahl-Hirschman index (HHI) computed on these six packages comes out to 2,419, the upper end of "moderate" (1,500-2,500) and just below the "highly concentrated" cutoff. Translation: a stack picked at random today is overwhelmingly likely to point at one of two companies' wire formats.
The structural read is that LLM applications converged toward thin SDKs plus orchestration code that the team owns, rather than heavy framework abstractions that the team rents. That is the inverse of how the JavaScript ML category looked in 2023.
Anthropic's silent compounding: 962% on a 5M baseline
The single most striking trajectory in the dataset belongs to
@anthropic-ai/sdk. On a 4-week trailing basis it grew from 5.27M
downloads in late April 2025 to 55.96M by mid-April 2026, a +962%
expansion in twelve months. In raw weekly terms it added more downloads
in 12 months than LangChain JS has accumulated in total, and almost three
times the +331% growth the OpenAI SDK posted off a much larger
starting line.
Most of that compounding happened in two phases. The first lift, roughly May-August 2025, was steady; the second, October 2025 onwards, was step-function. Anthropic shipped Claude Sonnet 4.5 and Opus 4.5 inside this window and the SDK trajectory mirrors the model release cadence almost exactly. By the final quarter of the window the SDK was tracking within ~24% of OpenAI's volume despite OpenAI's 5-year head start in the developer tools market.
Two facts complicate the headline. First, a sizable share of the lift is
Claude Code itself: the official CLI ships with the TypeScript SDK as a
runtime dependency, and every user npm install-ing it counts. Second,
Anthropic's repo carries only 1,894 GitHub stars, the lowest in our
basket; we will come back to what that says about stars as a usage
signal in section 5.
Vercel `ai` displaces LangChain JS as the framework default
Inside the framework lane, the picture flipped. Vercel's ai package, a
deliberately small hooks-first wrapper, now pulls 20.4% share against
LangChain JS at 4.1%, a 5.0× lead. Twelve months earlier the two
were within shouting distance.
The flip was not driven by LangChain JS shrinking in absolute terms.
LangChain JS actually grew 173% year over year, comparable to the
growth most React libraries posted in the same window. It just grew
slower than the category: provider SDKs added users at well above 300%
and the ai package itself added users at +751%. That is what
relative decline looks like; nobody left, the rest of the room got
bigger.
LlamaIndex.TS, at 0.2% share, is effectively absent from the JavaScript AI conversation. Most of the LlamaIndex audience runs Python, and the TypeScript port has not built an independent gravity well. We keep it in the basket as the most generous possible counterweight to the "frameworks lost" reading; including it does not change the picture.
The narrative implication for anyone choosing a thin abstraction in 2026
is that the framework race is no longer an open question on the JS side.
Vercel ai is the consensus thin layer, and developers picking
LangChain JS today are picking against the trend rather than with it.
Release cadence: who is actually shipping
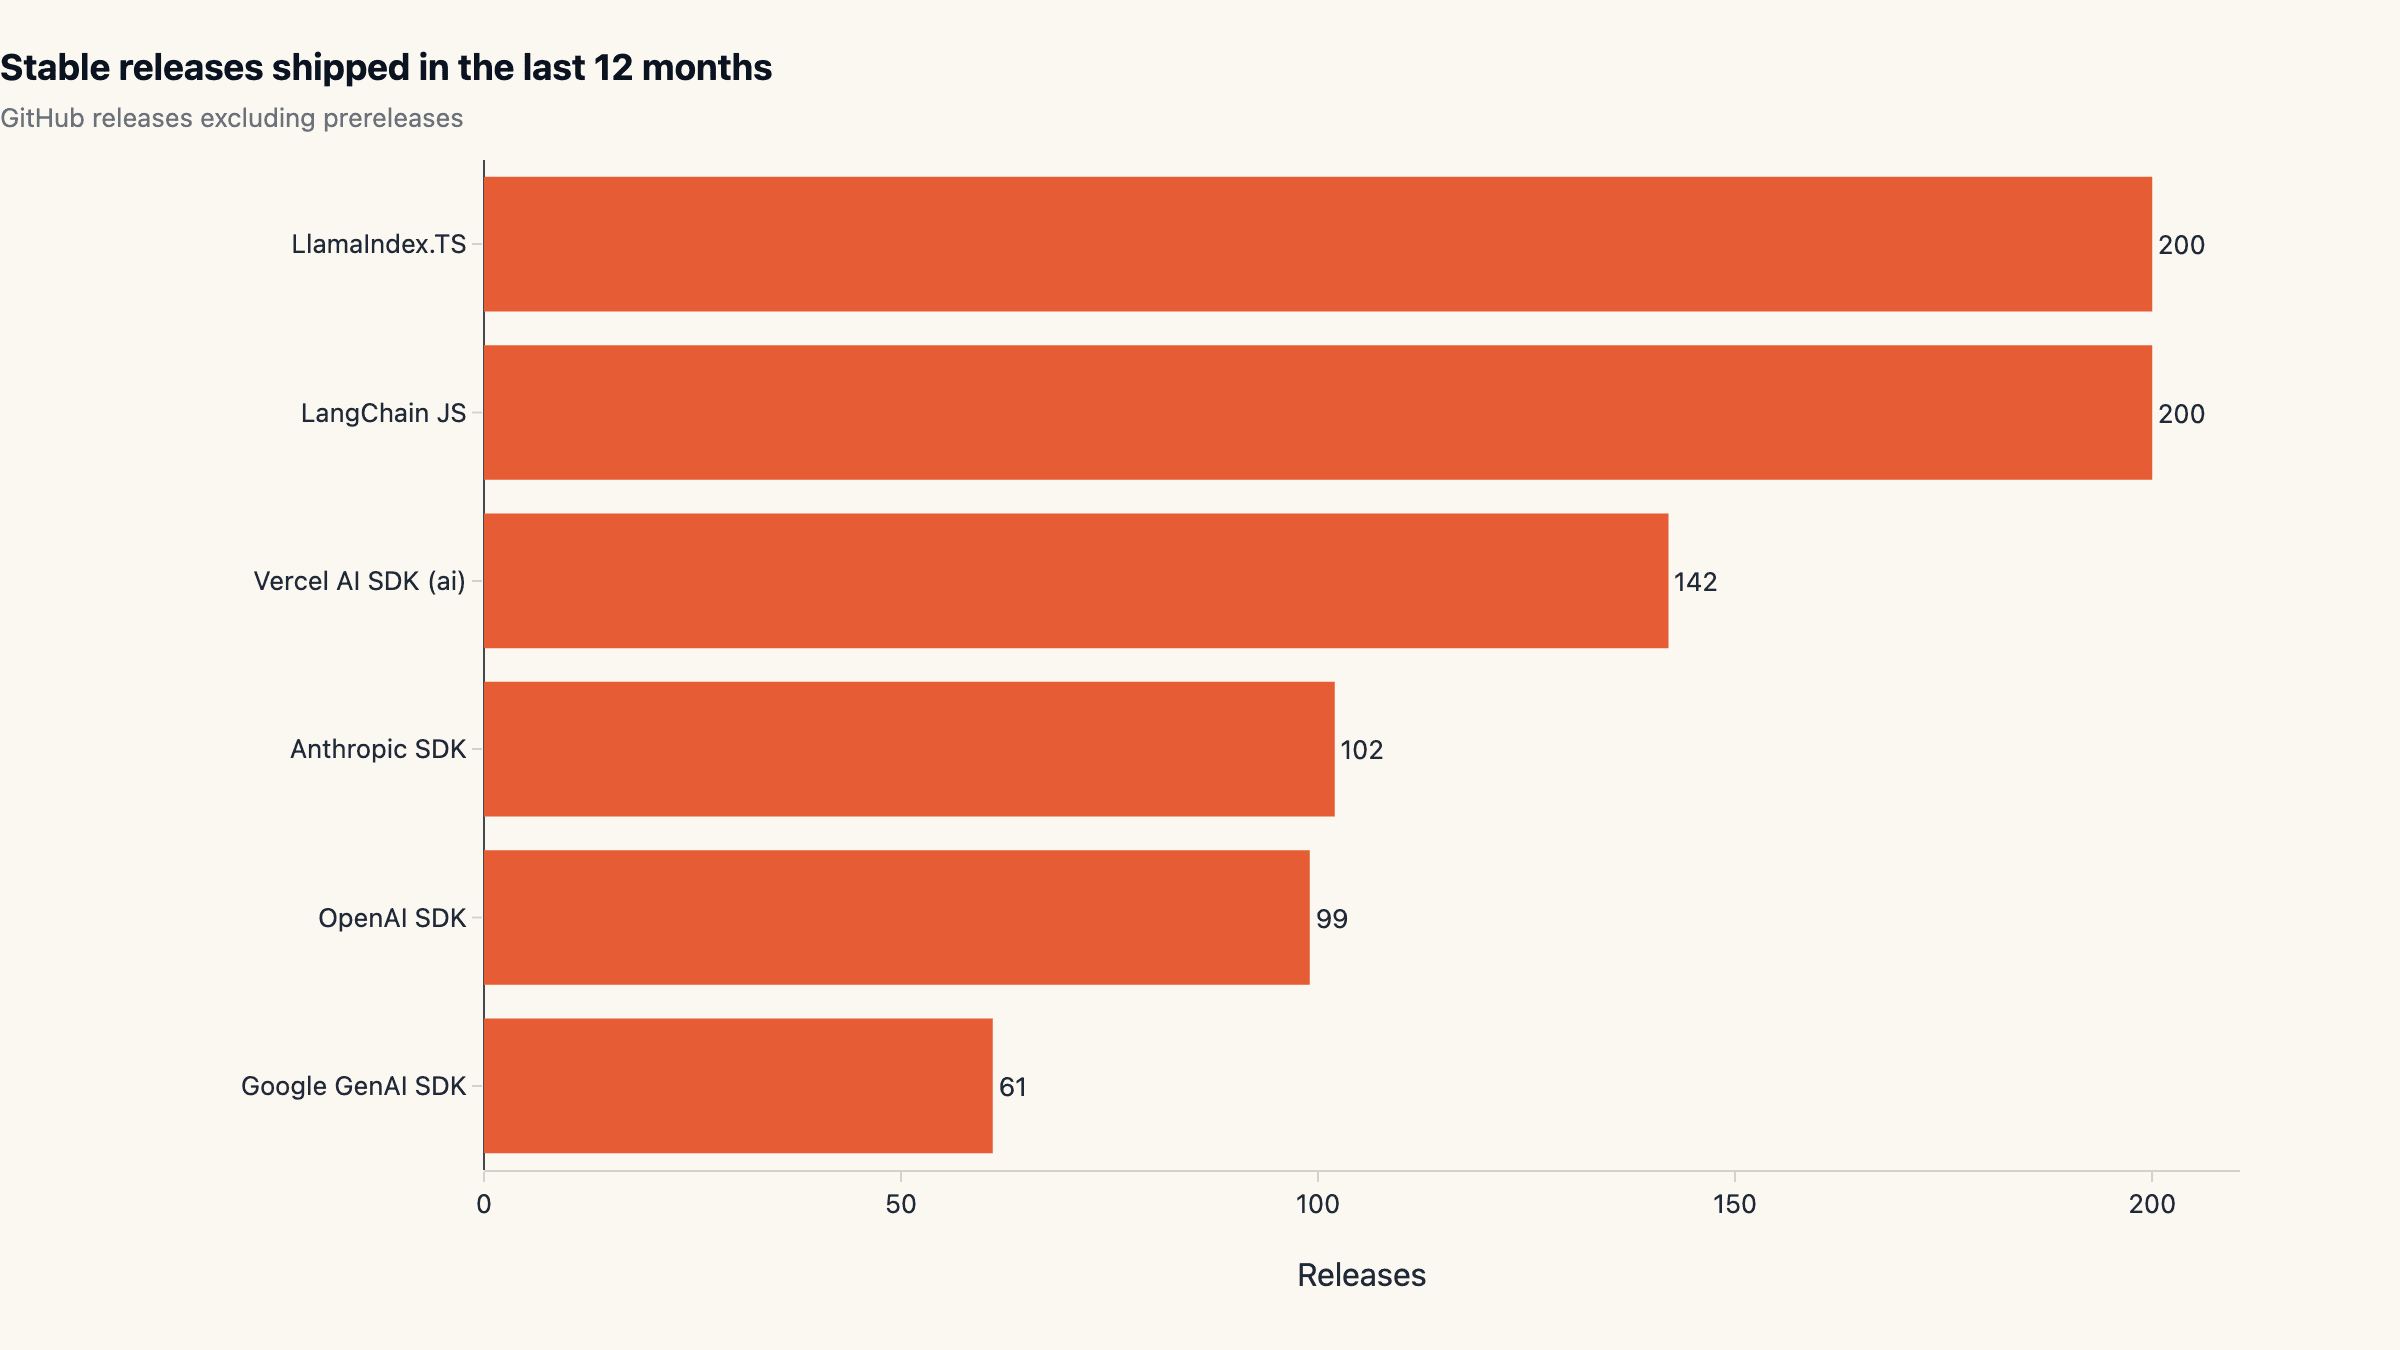
Stars-and-downloads describe demand. Release cadence describes whether a project is keeping up. We pulled 12 months of stable releases (excluding prereleases) for each repo and counted them; the answer is that 862 stable releases went out across the six packages in the period.
The frameworks ship hardest. LangChain JS and LlamaIndex.TS each hit
our 200-release pagination cap in 12 months, meaning their actual
cadence is at least four versions per week. Vercel's ai shipped 142
stable releases. The provider SDKs are slightly slower in absolute
count but more consistent: OpenAI 99 (median gap 2 days),
Anthropic 102 (median gap effectively zero, multiple same-day
patches the norm), Google GenAI 61 (median gap 5.5 days, the slowest
in the basket).
Two reads matter here. First, the provider-direct SDKs are not "static" tools; they ship roughly every two days. Picking them is not a bet on a static API surface. Second, Google GenAI's slower cadence is consistent with its from-zero curve; it is the youngest repo in the basket at 508 days versus OpenAI's 1,596. Whether that is "early" or "deferred maintenance" is a judgment call the next 12 months will settle.
Frameworks hitting our pagination cap is a measurement edge. We do not think it changes the directional story: framework-lane velocity has not collapsed, the framework-lane attention has.
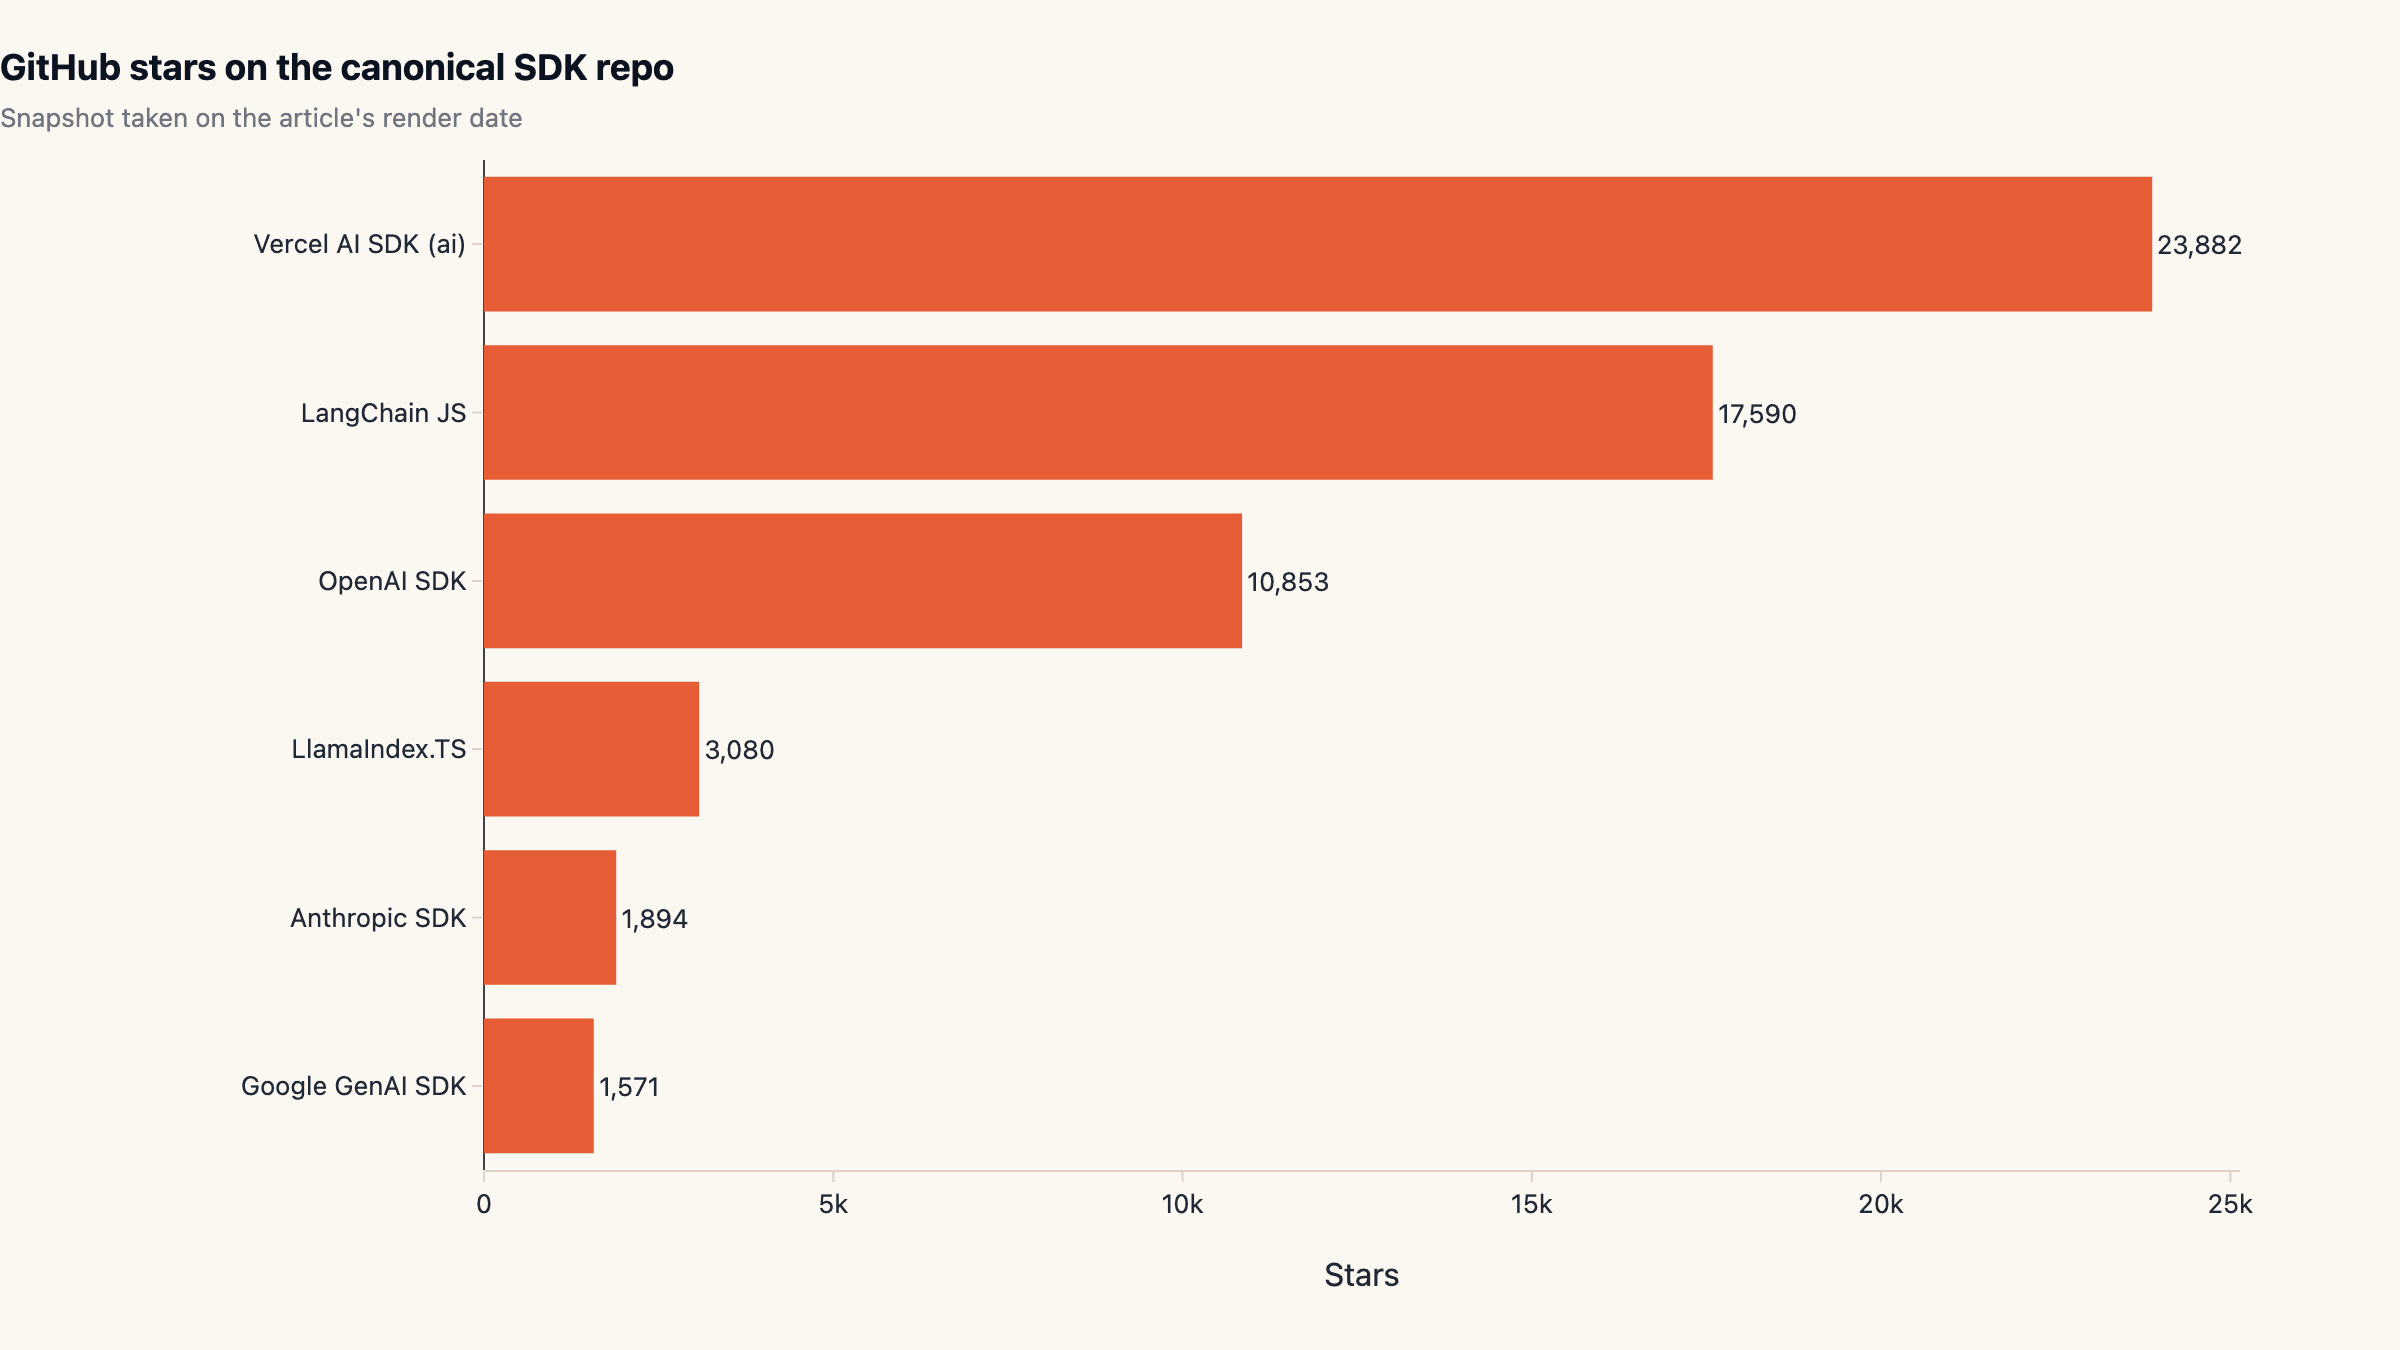
Stars vs downloads: a 56× divergence
The most useful single metric we computed is GitHub stars per million downloads, a rough "vanity ratio" that asks how many people have bookmarked the repo for every million developers actually pulling the package. Lower numbers mean an SDK that gets used more than it gets bookmarked, the production-friendly direction. Higher numbers mean the opposite: a star magnet that does not show up in build pipelines.
Anthropic SDK posts the lowest ratio in the basket: 28.5 stars per
million downloads, with 1,894 stars against 66M / 4-week installs.
Google GenAI is similar at 32.4. OpenAI sits at 125.6, four
times Anthropic's ratio but still production-heavy. Vercel ai is
437.4. LangChain JS is 1,612, and LlamaIndex.TS is 4,615,
the highest ratio in the basket and roughly 162× Anthropic's.
The gap between Anthropic's 28.5 and LangChain JS's 1,612 is a 56× multiple, on the same axis. Whatever else stars measure, they are not a substitute for production telemetry. They overweight projects that show up at the top of "awesome" lists and undercount projects that ship as runtime dependencies of mainstream consumer tools.
The takeaway for tool selection is direct: filtering AI SDKs by GitHub stars systematically deprioritises the SDK that the most production workloads actually depend on. If your stack-evaluation rubric still starts with star count, it is selecting against your production reality.
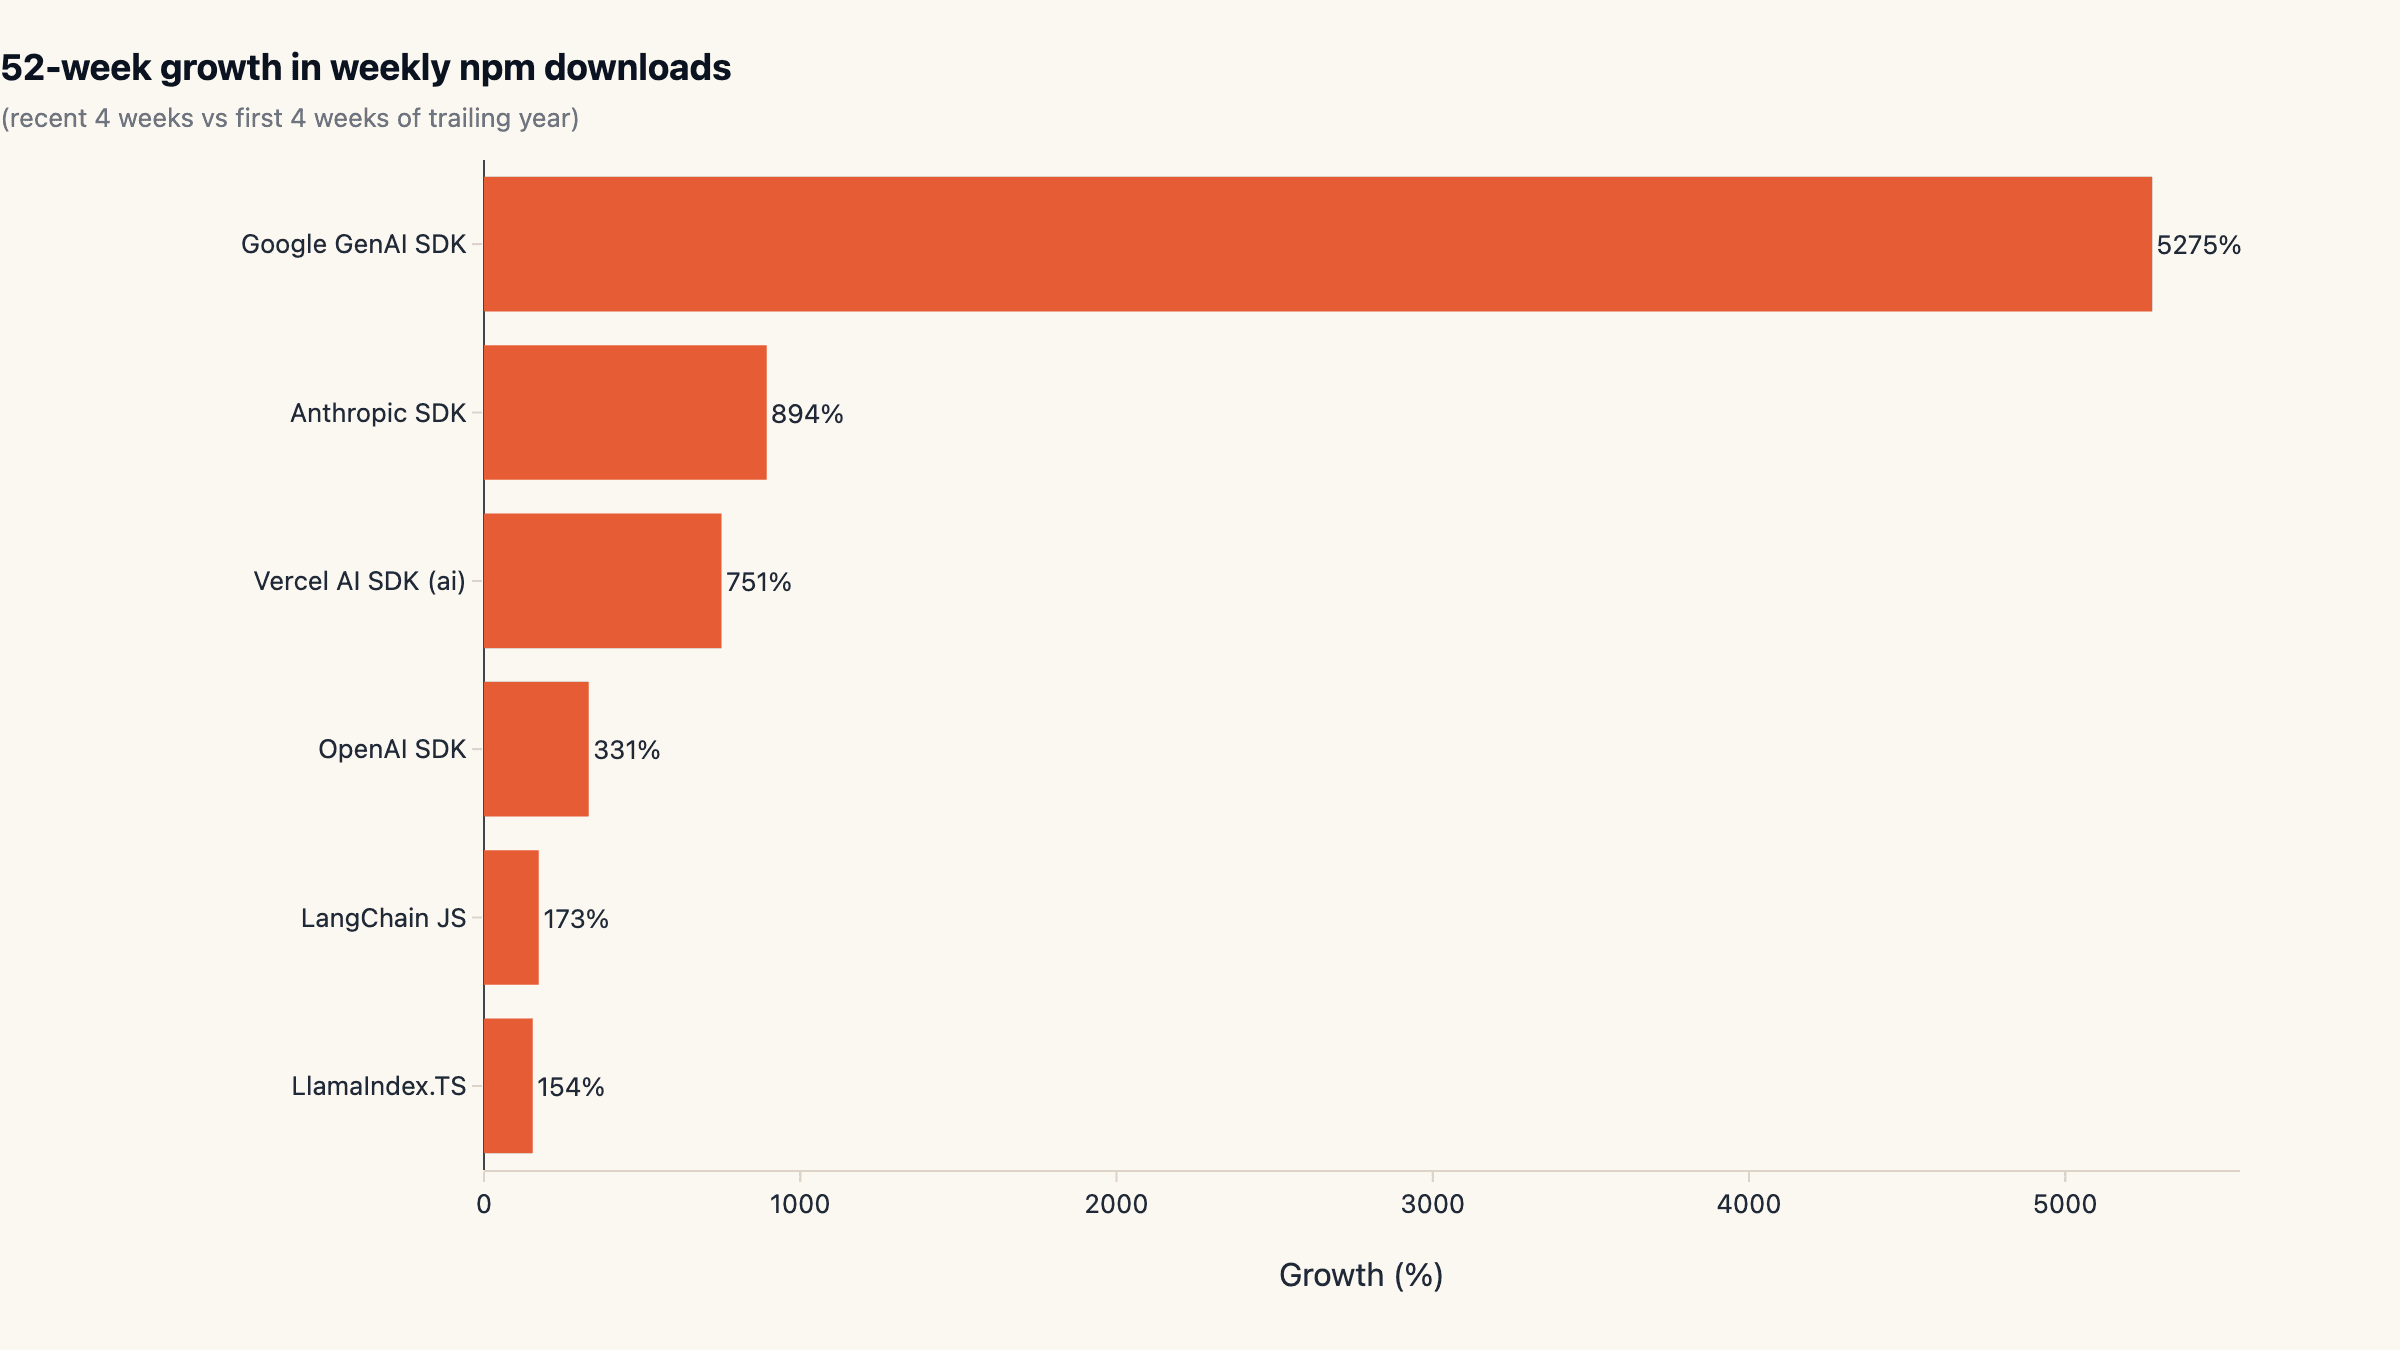
Year-over-year growth: where new attention went
Comparing the trailing four weeks of the period against the first four weeks of the period gives a clean year-over-year growth rate per package. Every package in the basket is growing; that is not a tie-breaker.
In percentage terms the leader is Google GenAI at +5,275%, almost
entirely an artifact of its near-zero starting line in May 2025; the SDK
did not exist as a meaningful presence at the start of the window. The
more telling number is @anthropic-ai/sdk at +894% off an already
non-trivial base. OpenAI grew +331% off the largest base in the
basket, an absolute add of ~66M weekly downloads.
Inside the framework lane, Vercel ai posted +751% and LangChain JS
+173%. The 4× ratio between them is what produced the share
compression we walked through in section 3.
Reading the chart: the bottom of the growth list is not a list of losing packages. It is a list of packages that grew slower than the category. There are no negative numbers here, only relative compression.
What this means if you are picking a stack today
Three operating heuristics fall out of the data. Default to provider- direct SDKs for production paths. They own 75% of the tracked volume, ship every 2-3 days, and are how the production agents we see in the wild are actually wired up. The orchestration layer is increasingly something teams own rather than rent; framework wrappers buy you less than they did 18 months ago.
For the multi-provider thin-layer slot, pick Vercel ai. It is the
framework-lane consensus, has 5× the install volume of LangChain JS,
and ships at high cadence. LangChain JS is fine if you have an existing
investment, but you are picking against trend rather than with it.
Stop ranking by GitHub stars. A 56× divergence between two packages on stars-per-download means the metric stopped informing tool selection. Use install volume and release cadence as primary signals; treat stars as a vanity metric, not a procurement input.
A note on multi-vendor strategy: the OpenAI SDK vs Anthropic SDK
race is no longer one-sided. Anthropic's compounding is steep enough
that single-vendor coupling to OpenAI now carries a real switching-cost
surface that did not exist 12 months ago. The cleanest hedge is keeping
the orchestration layer provider-agnostic, which is exactly what
Vercel ai and the Google GenAI SDK's compatibility helpers do today.
Teams that want to skip the orchestration build entirely can run any of
these SDKs through a sandboxed runtime; that is the path maxgent's
hosted agent platform is built around.
What we are not measuring
Three caveats for readers planning to act on this. npm download share is not user share. A heavy-CI shop can register more weekly downloads than a smaller shop running production traffic, and our numbers cannot separate them. Treat package-vs-package ratios as robust and absolute volumes as inflated.
The Python ecosystem is a different country. Numbers here say nothing about pip-resolved adoption of LangChain Python, LlamaIndex Python, the Anthropic Python SDK, or the OpenAI Python SDK. The download split could look very different on PyPI, and Python is still the larger ML ecosystem by raw researcher count.
Star count is one cross-source signal; commit volume, contributor diversity, and release-note depth are others we did not pull this iteration. Anthropic's release cadence (102 stable in 12 months, effectively daily on average) is a usable proxy for engineering throughput; doing the full version-by-version diff to estimate engineer- hours would tighten the picture considerably and is on our list for the next quarterly update.
We will refresh this dataset every three months. The slug at the top of this article is permanent; subsequent versions will appear as updated sections rather than new URLs, so any backlinks to this report stay valid as the numbers evolve. For the in-progress index of all maxgent research, see the research blog feed.
Cite this research
maxgent (2026). The AI SDK Wars: Who Actually Owns the JavaScript AI Stack in 2026. https://maxgent.ai/blog/ai-sdk-wars-npm-2026/
Charts and data are released under CC-BY 4.0. Please link back when reusing.
Dataset & charts
All data and charts released under CC-BY 4.0. Please link back when reusing.
Raw data
Embeddable charts
- anthropic-trajectory.html 4.7 KB
- github-stars.html 2.9 KB
- growth.html 2.9 KB
- release-cadence.html 2.9 KB
- share-over-time.html 15.7 KB
- share.html 2.9 KB
- weekly-trend.html 15.3 KB
Want one of these charts on your blog or report? Click Copy embed next to any chart to copy a ready-to-paste HTML snippet (with attribution), then paste it into your page.
MoClaw Research publishes quarterly data studies on the AI tools ecosystem, drawing on public registries (npm, GitHub, Hugging Face, arXiv, Google Trends). All charts and datasets ship under CC-BY 4.0.
Ready to automate with AI?
MoClaw brings AI agents to the cloud. No setup, no coding required.
References: npm registry downloads API · GitHub REST API (repos + releases)