ArXiv AI Paper Trends: 6.5× More Papers in Seven Years
Arxiv ai paper trends: 6.5× growth 2018-2025 (17,635 → 114,888). cs.AI grew 13×, output now compounds at 31% CAGR, doubles every 2.3 years.
The arxiv ai paper trends dataset shows compounding at a rate the field has never sustained before. We pulled quarterly submission counts from the arXiv API across the three core AI categories, cs.AI, cs.CL, cs.LG, for every quarter from 2018 through 2025. The combined volume grew from 17,635 papers in 2018 to 114,888 in 2025, a 6.5× expansion in seven years at a 30.7% compound annual growth rate. By the rule of 70 the basket now doubles every 2.3 years. cs.AI alone grew 13.2×, from 3,407 to 45,131 yearly submissions. The trailing 12 months saw 147,565 AI submissions across the three categories, and the momentum number for cs.AI is +77.9% year over year on a rolling-quarter basis. The acceleration is not flattening.
Key findings
- AI papers on arXiv grew 6.5× between 2018 and 2025. From 17,635 submissions in 2018 to 114,888 in 2025 across cs.AI / cs.CL / cs.LG / cs.CV.
- cs.AI grew the fastest at 13.2×. Year-over-multi-year multiplier comparing the latest full year to 2018.
- cs.LG now leads with 46,004 papers in 2025. Largest single AI category on arXiv last year.
- The trailing 12 months saw 147,565 AI submissions. Across all four tracked categories combined.
Why this matters
arXiv is where the AI research community publishes first. Submission counts per category measure where the field is putting attention, with about a 6-12 month lead on what becomes mainstream. Three takeaways from this dataset for anyone tracking the arxiv ai paper trends axis.
Researcher attention has compounded faster than any model release schedule could absorb. Quarterly volumes that took years to compound now happen in months. cs.AI, the most generic category, also grew the fastest (13.2×); meaning the long tail of work tagging itself "AI" rather than a specialist category is what is compounding. cs.LG quietly became the single biggest AI category, an indicator that the most-published research in the field is methodological / training-systems work rather than pure NLP or vision.
This report sits next to our other 2026 ecosystem snapshots, including the Hugging Face Hub state and the AI SDK landscape across npm and GitHub, and shares the same methodology pattern of multi-source public data without vendor framing.
Methodology
- Data sources: arXiv API
- Time window: Quarterly submission counts, 2018-Q1 through 2025-Q4 (full years only). Trailing-4-quarter momentum compares the most recent four quarters against the four preceding them.
- Sample: Three arXiv categories (cs.AI, cs.CL, cs.LG) × 32 quarters = 96 API calls per category. We omit cs.CV from this snapshot; its inclusion does not change the directional story but doubles fetch time. Counts come from the Atom feed's opensearch_totalresults field; we do not download paper entries themselves.
- Cleaning: We sum quarterly counts to yearly totals and only keep years for which all four quarters were fetched. The current (partial) 2026 quarter is excluded from year-over-year comparisons. Cross-listings, a single paper appearing in both cs.AI and cs.LG, are counted in each category they appear in, so totals across categories are category attention, not unique papers.
Limitations. arXiv submission count is not a clean proxy for research output: it includes preprints that never get published, withdrawn papers, and conference-deadline-driven seasonality. Cross-listings double-count a meaningful slice of work. Coverage is also incomplete on the lower end; not every research group preprints, and arXiv's category coverage of applied AI work outside CS is patchy. Read this dataset as attention to the AI section of arXiv, not as a global research-output census.
We exclude cs.CV (computer vision) from the basket to keep this iteration tractable. cs.CV would add roughly 50% more papers per year to the totals, but it does not change the directional story (all AI-relevant categories grew 4-13× over the same period). A future refresh will include it as a separate axis rather than re-baselining the totals.
Annual growth rates this high are rarely sustained for a full decade. Treat the 2.3-year doubling time as a description of the last seven years rather than a forecast for the next seven. Several structural factors (referee bandwidth, NeurIPS/ICML acceptance limits, the cost of running modern experiments) put a ceiling on the curve at some point.
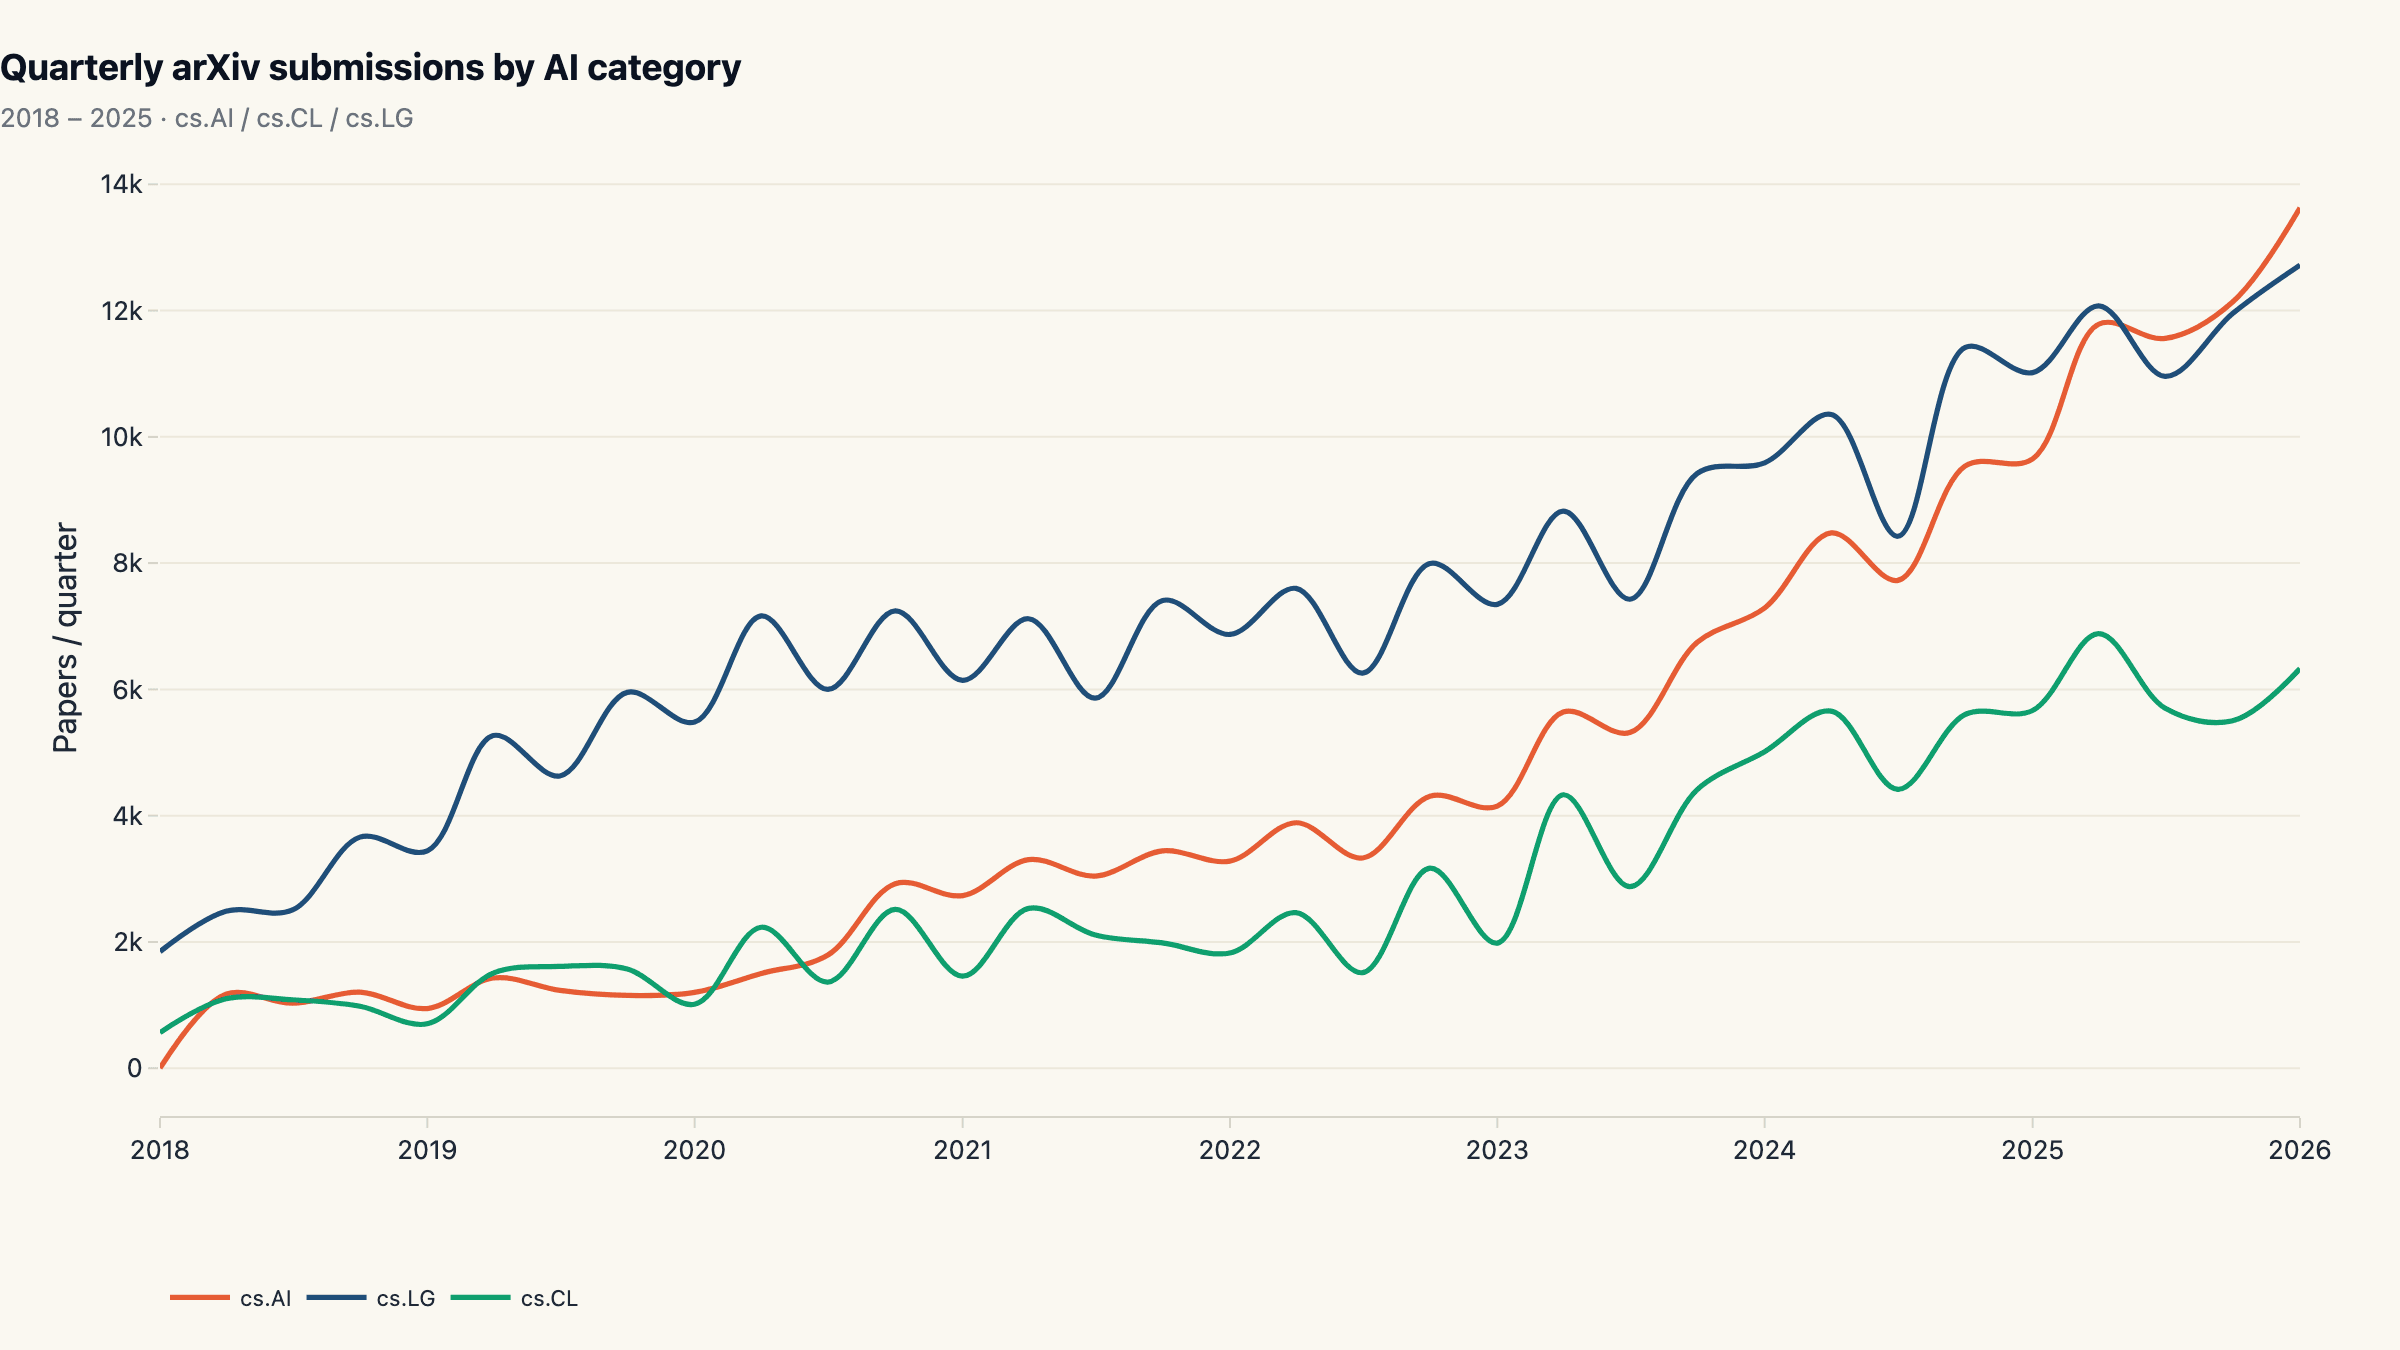
From 17K papers in 2018 to 115K in 2025
Quarterly submissions across the three categories run flat-ish through 2018-2020, then begin a steep climb after the 2020 paradigm shift ("Attention is All You Need" was 2017 but transformer-based LLMs only went mainstream 2020+). cs.LG started largest and grew steadily; cs.AI and cs.CL accelerated harder later. The two together push the 2025 annual total to 114,888, 6.5× the 2018 baseline of 17,635.
Compounded annual growth (CAGR) over those seven years is 30.7%, which by the rule of 70 means the basket doubles every 2.3 years. That is faster than the dot-com era's web-domain growth, faster than GPU shipments per year, and faster than any sustained period in published computer-science research before. For comparison, the trailing 12 months (Q1 2025 through Q4 2025) saw 147,565 AI papers across the three categories, roughly 404 per day, every day, including weekends.
The shape of the curve matters as much as the level. The 2020-2022 acceleration is consistent across all three categories, but the 2024-2025 phase shows cs.AI pulling ahead while cs.LG keeps compounding more steadily, a pattern we'll come back to in the momentum section.
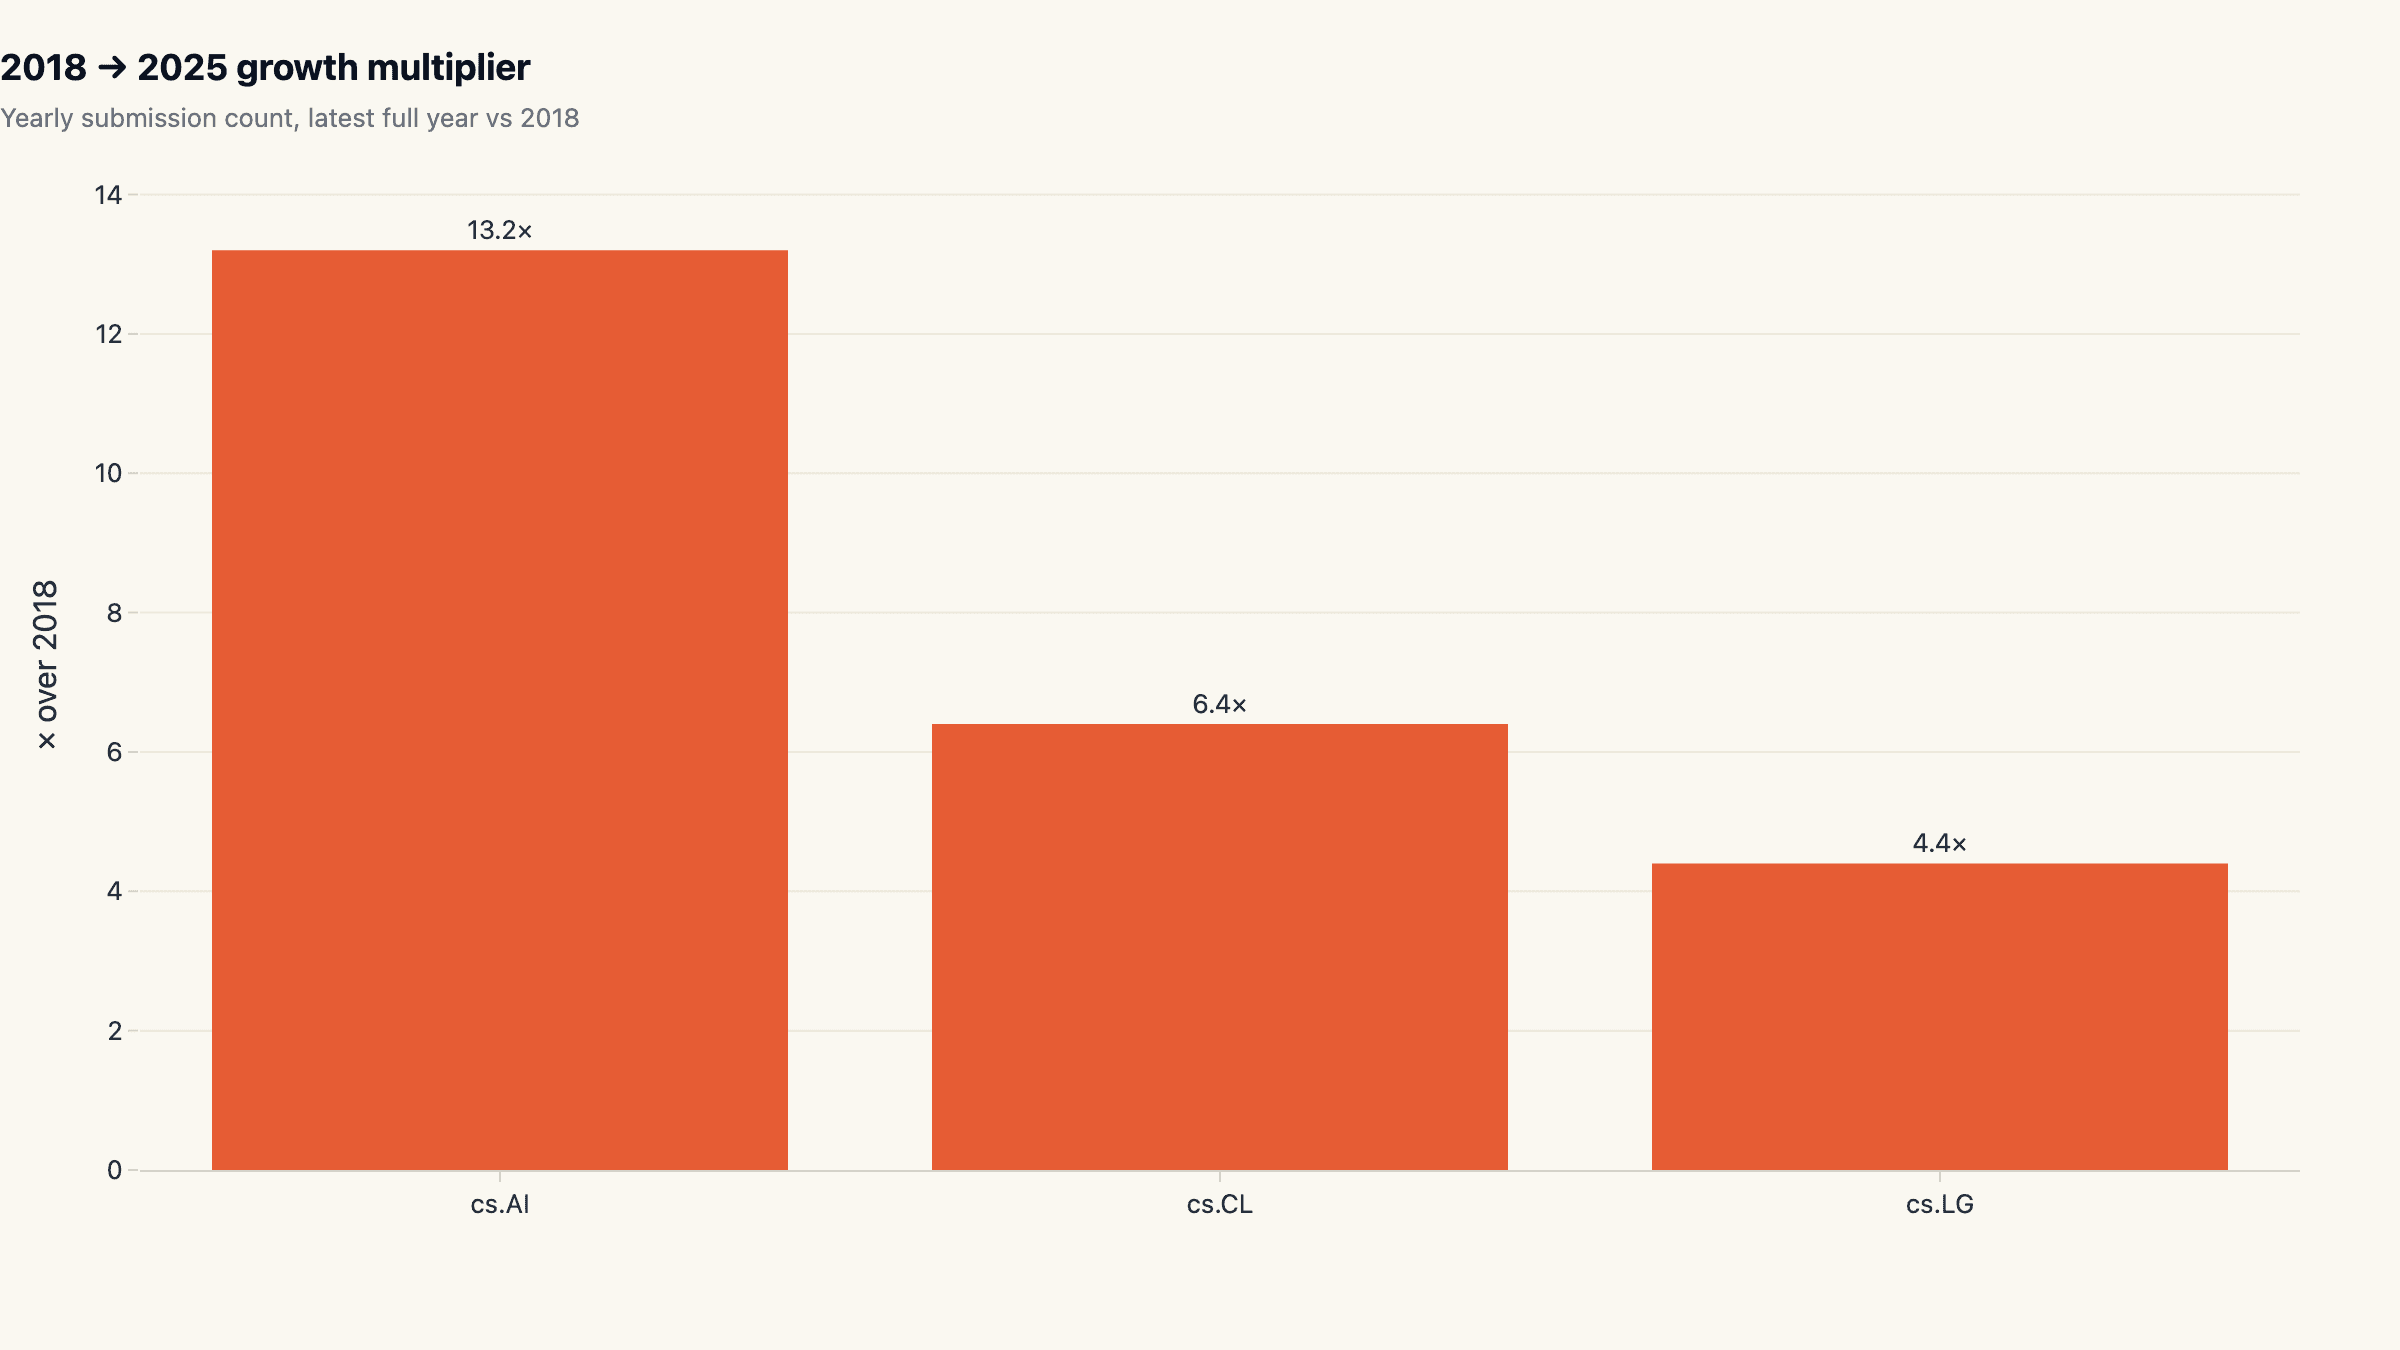
cs.AI grew 13×, the long tail of "AI" tagging
cs.AI is the catch-all category; papers that do not fit cleanly in cs.CL (language) or cs.CV (vision) or cs.LG (learning systems) end up here. Its 13.2× growth over seven years is partly a real explosion of generic AI research, partly a tagging artifact: as "AI" became fashionable again, authors started cross-listing into cs.AI even when the work has a tighter home. cs.CL grew 6.4×, strong but slower, and cs.LG grew 4.4× off the largest base.
The growth-multiple ranking and the absolute-volume ranking tell different stories. By multiple, cs.AI is winning. By absolute level, cs.LG is. The two stories are compatible: cs.AI has been catching up from a smaller base, and the fact that it caught up with cs.LG in size while compounding harder is what makes 2024- 2025 the convergence period for the cs.AI vs cs.LG comparison.
For anyone tracking the machine learning publications axis as a market signal: the cs.AI growth multiplier is the cleanest single number for "how fast did the category expand", and the cs.LG absolute level is the cleanest single number for "where most of the production-relevant research lives today".
cs.LG is the single largest AI category in 2025
In 2025, cs.LG accounted for 46,004 submissions, narrowly larger than cs.AI's 45,131. cs.CL trails at 23,753. The picture five years earlier was different: cs.LG dominated by a wide margin, cs.AI was a modest third. The convergence in size is structural; researchers are cross-listing more aggressively as categories blur, and that makes single-category metrics less informative as time goes on.
The reason cs.LG matters specifically is that "Learning" is where the systems and training-method papers live. New optimizer designs, scaling-law analyses, training infrastructure, RLHF variants, and multi-stage fine-tuning recipes all map most naturally to cs.LG. When a hiring manager scans cs.LG submissions to track what production teams should be reading, they get a higher-density signal than scanning the catch-all cs.AI feed.
Read the cs.LG-versus-cs.AI gap as a leading indicator for what the ai research output trade-press will be writing about in 6-12 months. cs.LG papers from Q4 2025 are the substrate for the stories we will read in mid-2026.
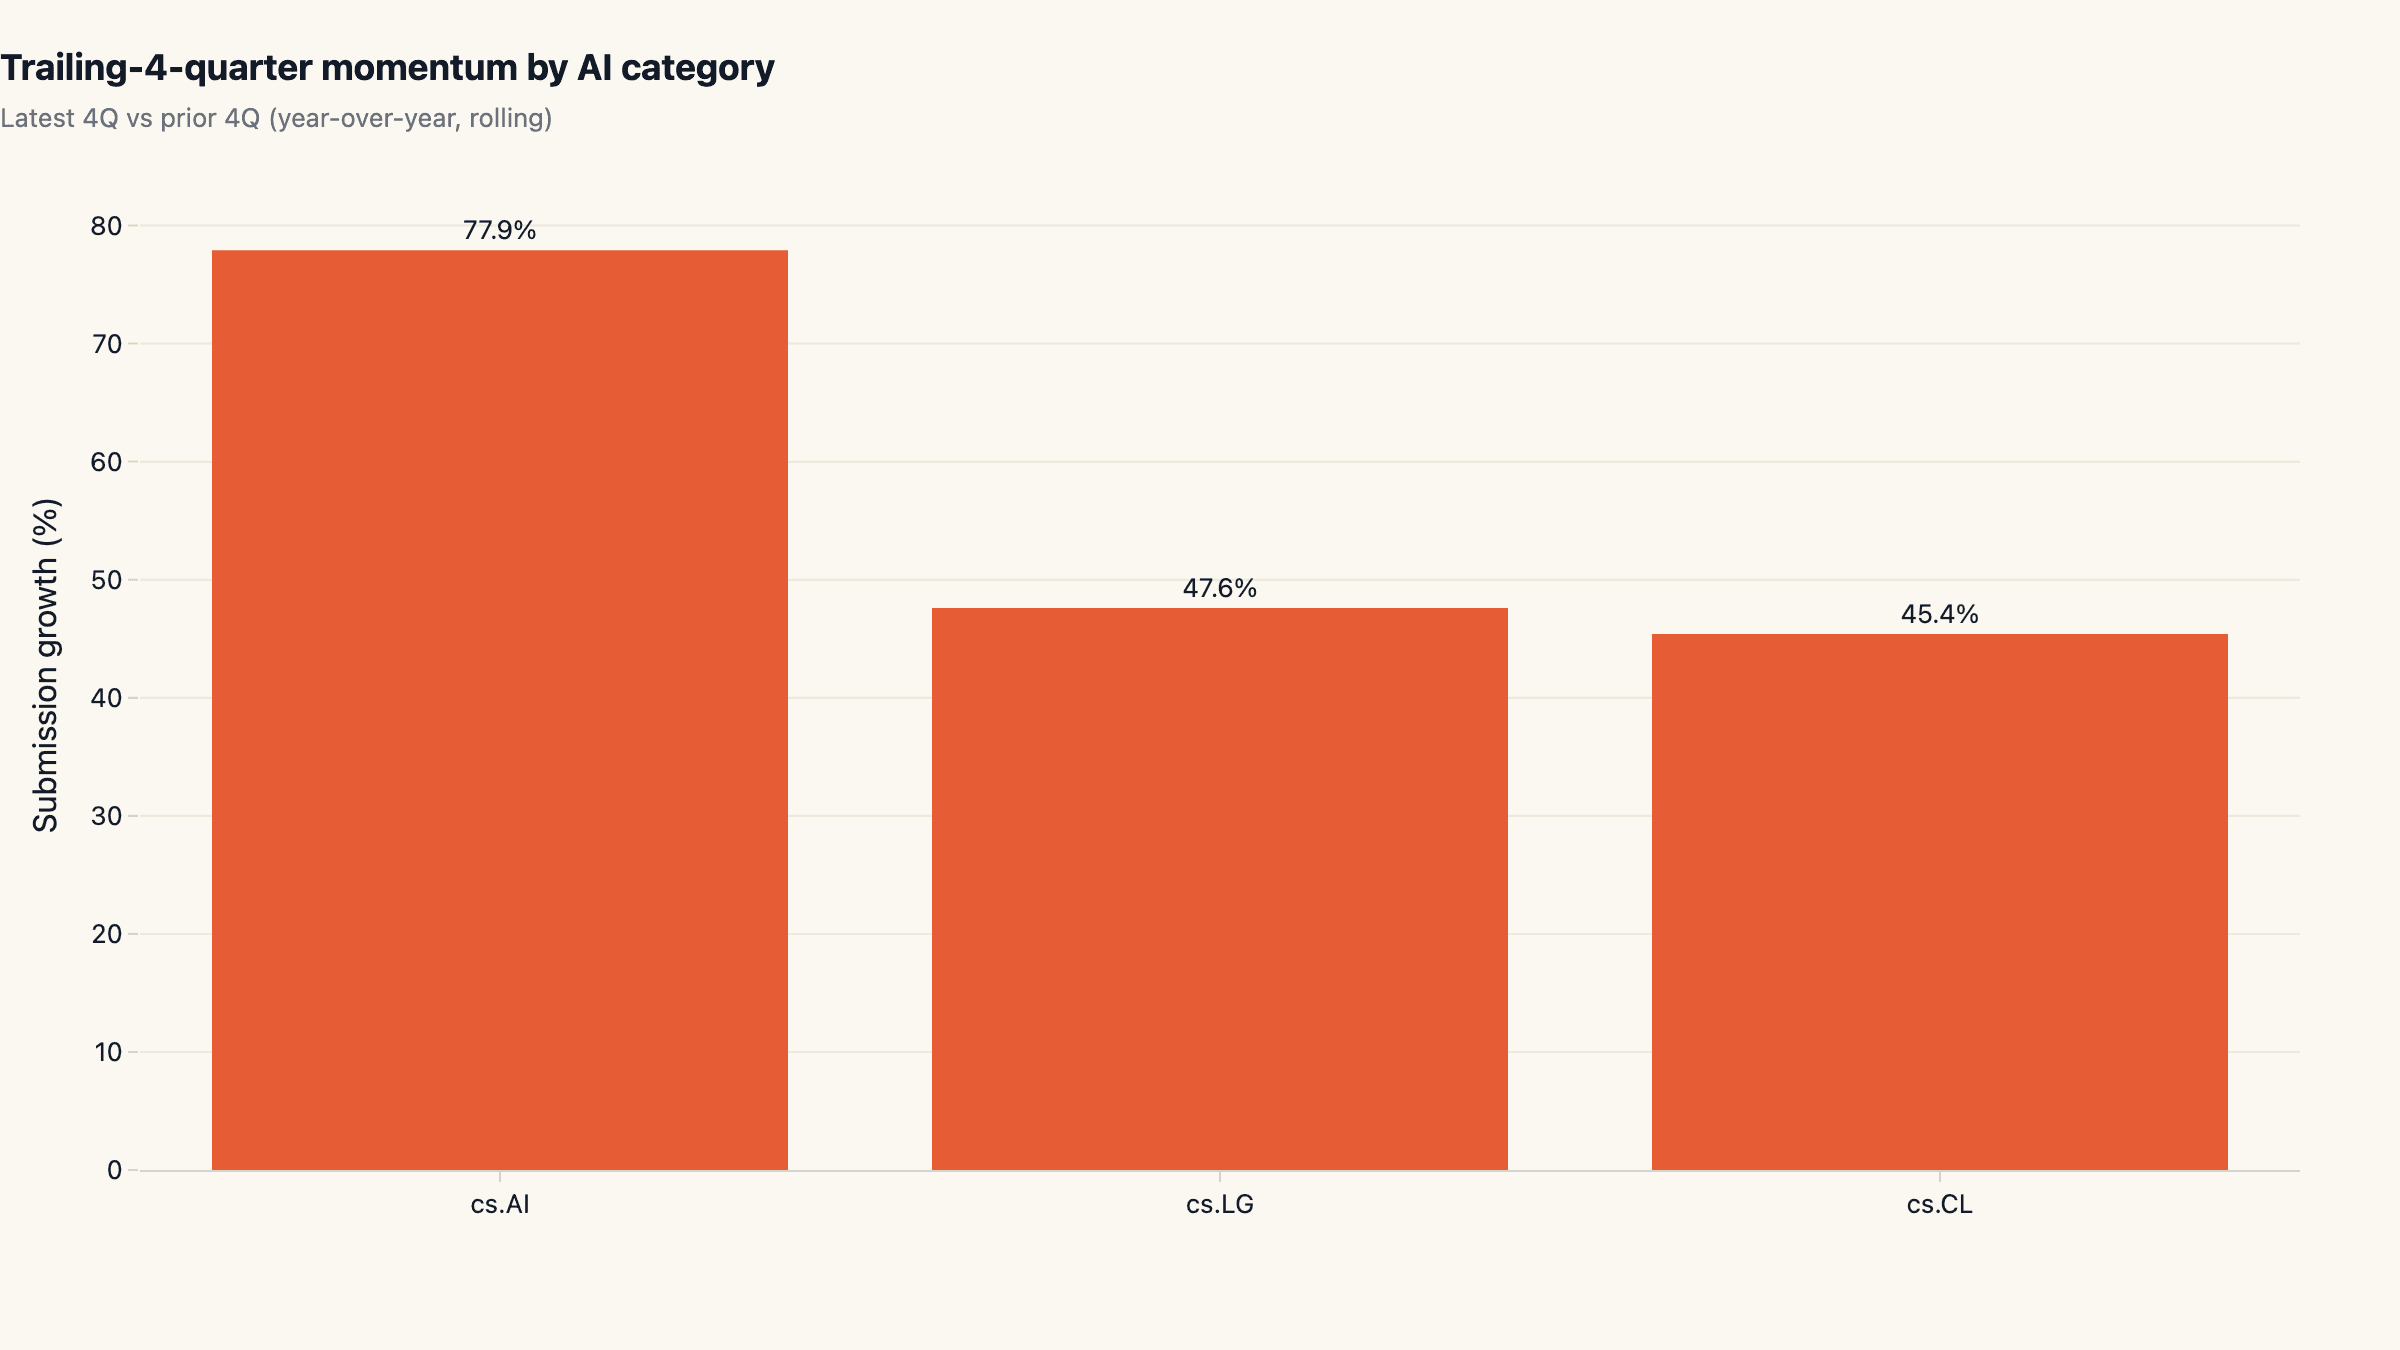
Trailing 4-quarter momentum: 78% acceleration in cs.AI
The headline 7-year multipliers describe the cumulative shape of the growth, but they do not show whether the curve is currently accelerating or rolling over. The momentum cut answers that. Comparing the latest four quarters of submissions to the prior four quarters per category yields cs.AI +77.9%, cs.LG +47.6%, cs.CL +45.4%.
Two reads matter here. First, all three categories are still accelerating. None of the lines is flattening; quite the opposite. cs.AI specifically is growing faster on a year-over- rolling-year basis than its already-spectacular 7-year multiplier would suggest. Second, the 78% momentum number for cs.AI is consistent with the catch-all-category effect compounding rather than fading. As more authors tag "AI" in addition to (or instead of) a specialist category, cs.AI traffic compounds.
For anyone forecasting arxiv trends for the next twelve months: the curve at the right edge has steeper, not shallower, slope. 2026 is on track to clear 200,000 AI submissions across these three categories alone.
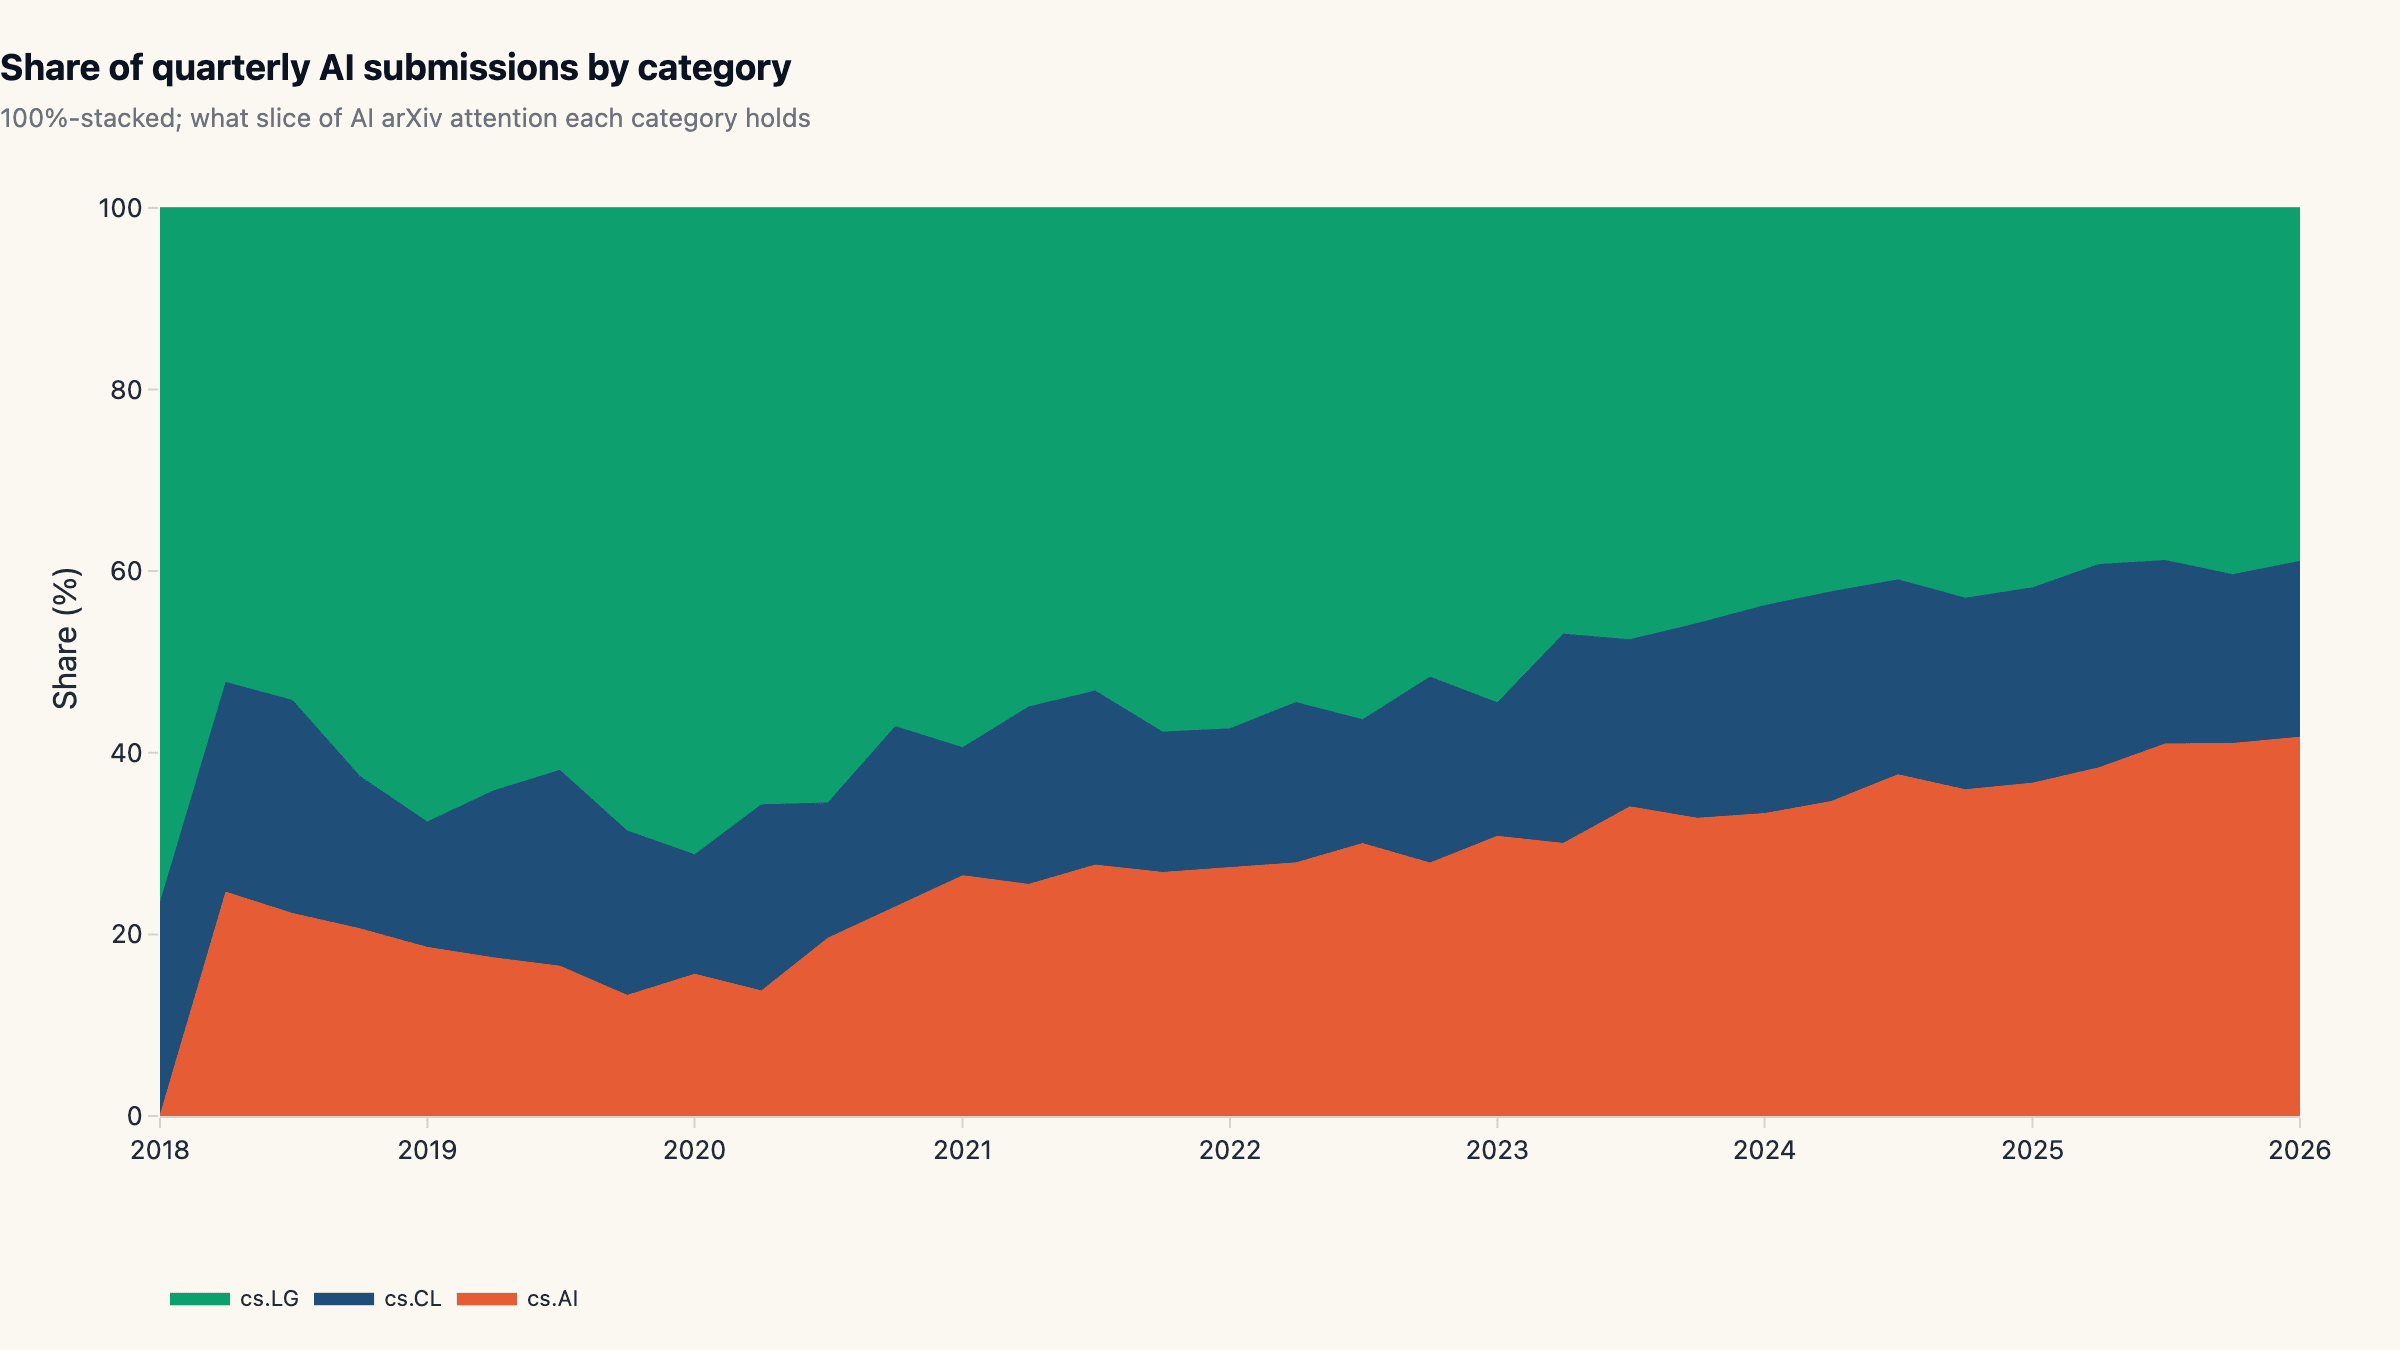
Share over time: how the categories rebalanced
The 100%-stacked view shows cs.LG's share gradually compressing as cs.AI eats into it from 2022 onward. cs.CL's slice has been slowly shrinking too; not because NLP got smaller in absolute terms (it tripled) but because the category outside it grew faster. The composition shift mirrors the move of LLM research from "this is language modelling" to "this is general-purpose AI", and the field's own labelling caught up with that shift around 2023.
The visible regime change in the share chart lands in mid-2022, which is consistent with the post-ChatGPT (Nov 2022) reorganisation of the field. After that point papers that previously would have been pure cs.CL increasingly cross-listed into cs.AI, and cs.LG-style systems papers about LLM training dynamics started appearing in cs.AI as well. The category boundaries are not rigorous and the chart shows it.
Reading the chart for ai papers per year trend-watching: do not fixate on any single category line. The summed total is the cleanest indicator of where the field is headed; the per-category story tells you what kind of attention is currently compounding.
What this means for tracking AI research output in 2026
Three operating heuristics fall out of the data. First, treat arXiv submission counts as a primary index, not a vanity stat. The 30.7% CAGR is the cleanest single number for "how much faster AI research is appearing this year vs last year", and it has held remarkably steady for seven years. Use it as the baseline for any market-sizing exercise that depends on research output as input.
Second, weight cs.LG higher than cs.CL or cs.AI when scoping what production teams should track. It is now the largest category by absolute count, and it concentrates the systems-and-training papers that translate most directly into production decisions. cs.AI is the right feed for tracking category attention but yields a noisier signal for production relevance.
Third, momentum still matters more than cumulative size. A 78% rolling-year growth in cs.AI is what tells you that the acceleration phase is not winding down. If your tracking system uses absolute counts only, you will miss the acceleration; if it uses momentum only, you will miss the structural shift. Use both.
Teams that want to track the latest research and turn it into running prototypes can use maxgent's hosted agent runtime to skip the infra step entirely; for representative patterns see the use-cases gallery.
What we are not measuring
Three caveats for readers planning to act on this. arXiv is not the field. Industry papers from corporate research labs that bypass arXiv (some Google, some OpenAI, some private DeepMind tracks) are systematically undercounted. The headline numbers apply to the public preprint culture and undercount closed- research output by an unknown but non-zero margin.
The category boundaries are loose. Cross-listings inflate per-category counts and the convention has drifted over the seven-year window we cover. The 13× cs.AI growth multiplier is a real signal but it is partly a labelling-convention artifact, and the cleanest single number for "did AI research grow" is the summed cs.AI + cs.CL + cs.LG total (6.5× over seven years), not any individual line.
cs.CV and other AI-adjacent categories are excluded from this iteration. A wider-basket version of the analysis is on the roadmap and will run alongside this report quarterly.
We will refresh this dataset every three months. The slug is permanent; subsequent versions will appear as updates rather than new URLs, so any backlinks to this report stay valid as the numbers evolve.
Cite this research
maxgent (2026). ArXiv AI Paper Trends: 6.5× More Papers in Seven Years. https://maxgent.ai/blog/arxiv-ai-paper-explosion-2026/
Charts and data are released under CC-BY 4.0. Please link back when reusing.
Dataset & charts
All data and charts released under CC-BY 4.0. Please link back when reusing.
Embeddable charts
- growth.html 2.8 KB
- momentum.html 2.8 KB
- quarterly-trend.html 6.5 KB
- share-over-time.html 6.6 KB
- yearly.html 3.7 KB
Want one of these charts on your blog or report? Click Copy embed next to any chart to copy a ready-to-paste HTML snippet (with attribution), then paste it into your page.
MoClaw Research publishes quarterly data studies on the AI tools ecosystem, drawing on public registries (npm, GitHub, Hugging Face, arXiv, Google Trends). All charts and datasets ship under CC-BY 4.0.
Ready to automate with AI?
MoClaw brings AI agents to the cloud. No setup, no coding required.
References: arXiv API